Fig. A.1
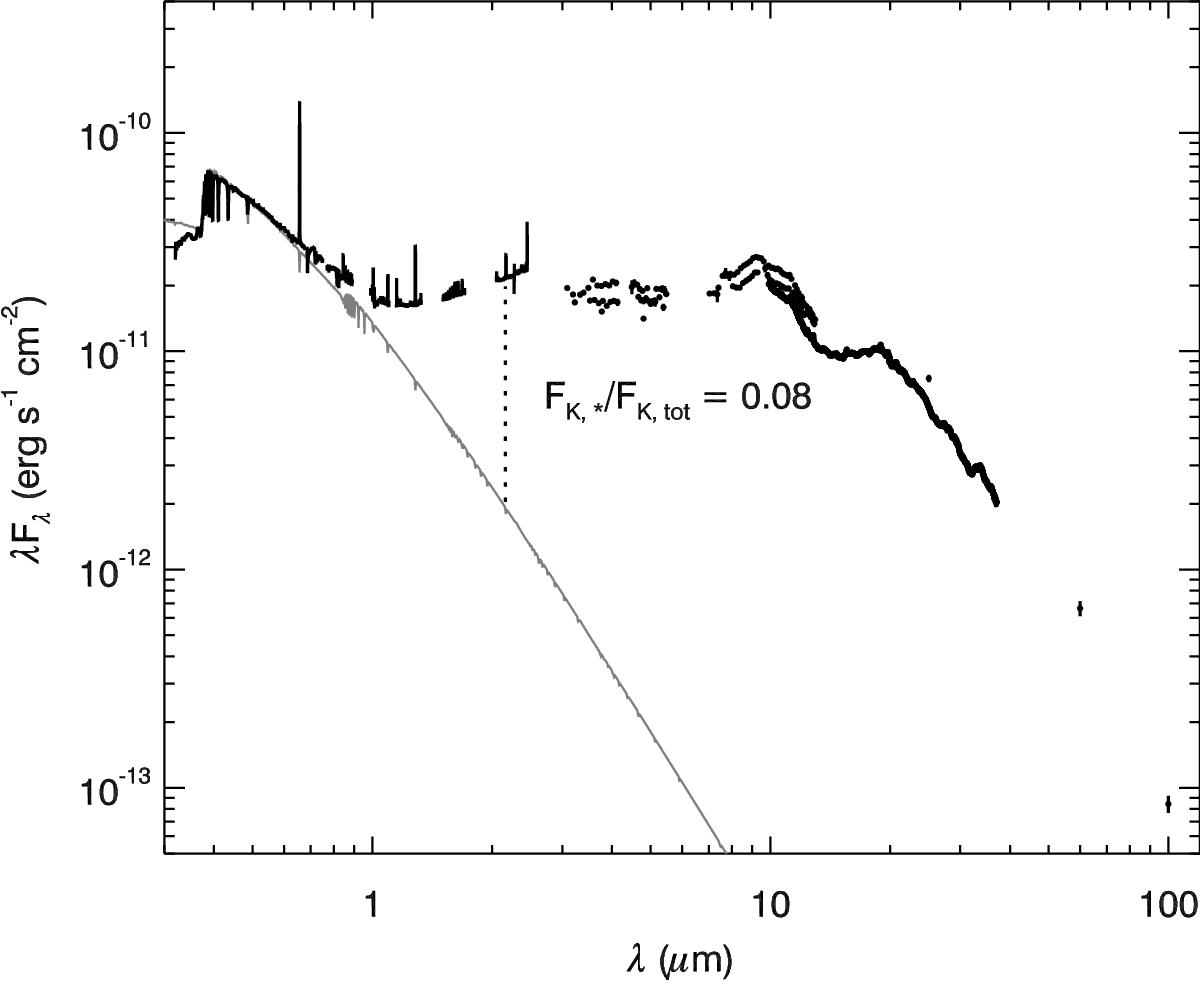
Spectral energy distribution; data from X-Shooter (black line), other data from Sitko et al. (2004, black symbols); model photosphere at 13 000 K (Kurucz 1993, gray line) and at d = 500 pc. The model is reddened with AV = 0.4 mag using the extinction law by Cardelli et al. (1989). The vertical dotted line corresponds to the stellar-to-total flux ratio in the K-band (λ = 2.16 μm), f = 0.08.
Current usage metrics show cumulative count of Article Views (full-text article views including HTML views, PDF and ePub downloads, according to the available data) and Abstracts Views on Vision4Press platform.
Data correspond to usage on the plateform after 2015. The current usage metrics is available 48-96 hours after online publication and is updated daily on week days.
Initial download of the metrics may take a while.