Fig. 1
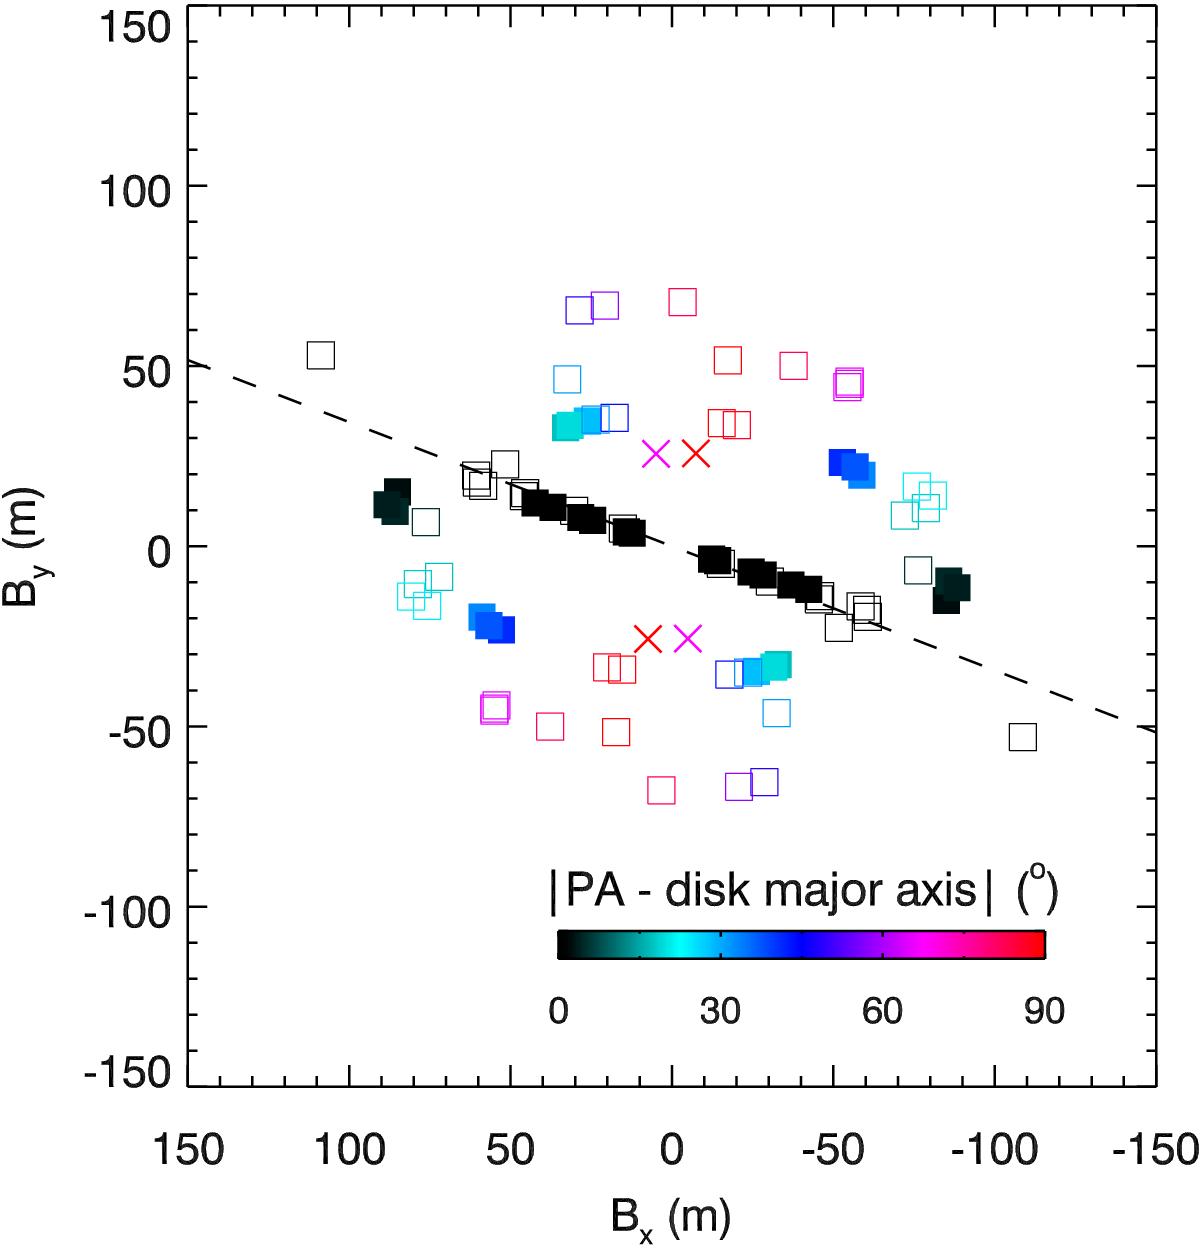
Coverage of the (u,v)-plane of the VLTI/AMBER-observations with ℛ ~ 12 000 (filled squares) and ℛ ~ 1500 (open squares). The two CHARA/VEGA-observations are also displayed (crosses). The dashed line is aligned with the major axis of the modeled disk ellipse (ψ = 71°). Colors indicate the baseline PA with respect to this line.
Current usage metrics show cumulative count of Article Views (full-text article views including HTML views, PDF and ePub downloads, according to the available data) and Abstracts Views on Vision4Press platform.
Data correspond to usage on the plateform after 2015. The current usage metrics is available 48-96 hours after online publication and is updated daily on week days.
Initial download of the metrics may take a while.