Fig. 9
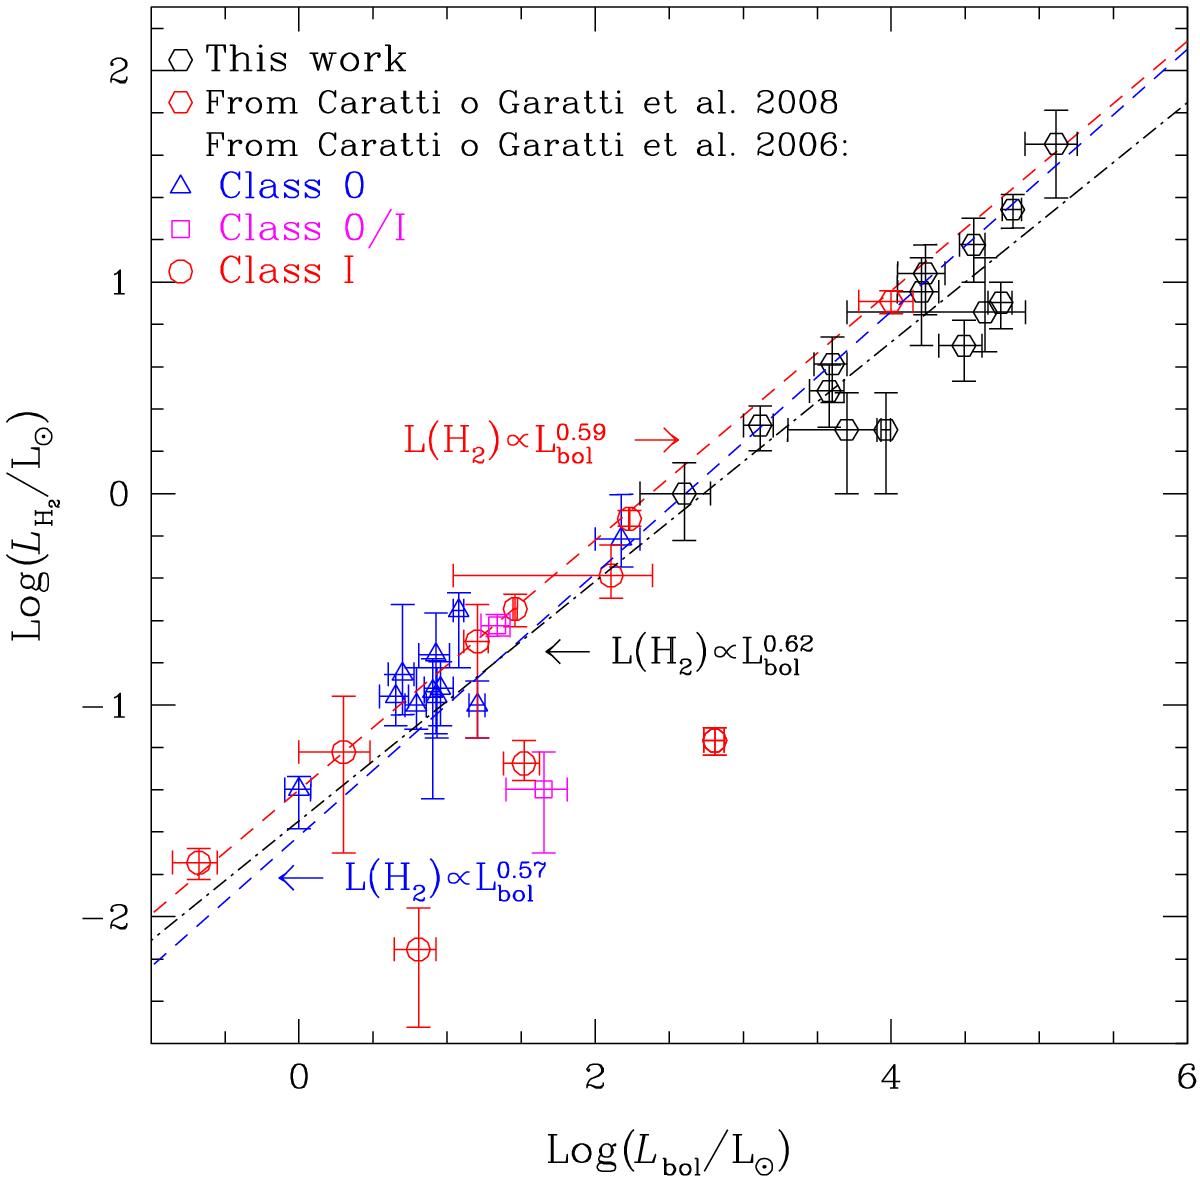
Log(LH2) vs. Log(Lbol). Results from the current survey (black hexagons) are combined to those obtained from previous works (Caratti o Garatti et al. 2006, 2008) as labelled in the upper left corner. The red dashed line indicates the previous fit from Caratti o Garatti et al. (2006), which includes only low-mass jets and excludes the four low-mass outliers. The blue dashed line shows the best linear fit resulting from the whole sample of HMYSOs. The black dash-dotted line shows the best linear fit resulting from HMYSOs, excluding the five high-mass outliers.
Current usage metrics show cumulative count of Article Views (full-text article views including HTML views, PDF and ePub downloads, according to the available data) and Abstracts Views on Vision4Press platform.
Data correspond to usage on the plateform after 2015. The current usage metrics is available 48-96 hours after online publication and is updated daily on week days.
Initial download of the metrics may take a while.