Free Access
Fig. 6
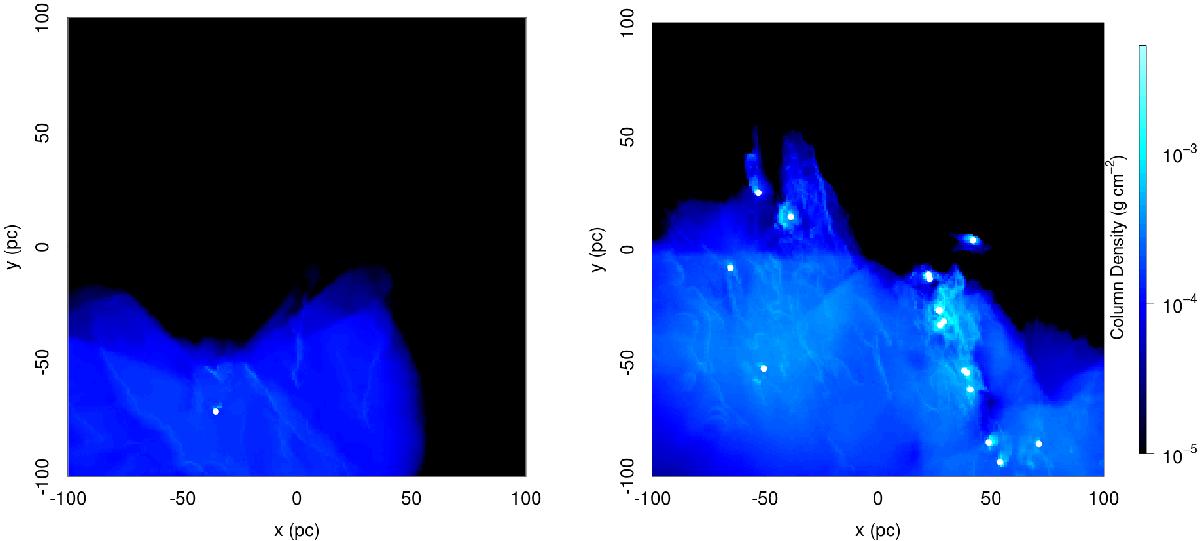
Distribution of the ionised gas particles at the start (left) and end of the MCPI simulation (right). Brighter regions have a higher fraction of the gas ionised and hence removed from the star formation process. The positions of the ionising sources are marked by filled white circles.
Current usage metrics show cumulative count of Article Views (full-text article views including HTML views, PDF and ePub downloads, according to the available data) and Abstracts Views on Vision4Press platform.
Data correspond to usage on the plateform after 2015. The current usage metrics is available 48-96 hours after online publication and is updated daily on week days.
Initial download of the metrics may take a while.