Fig. 11
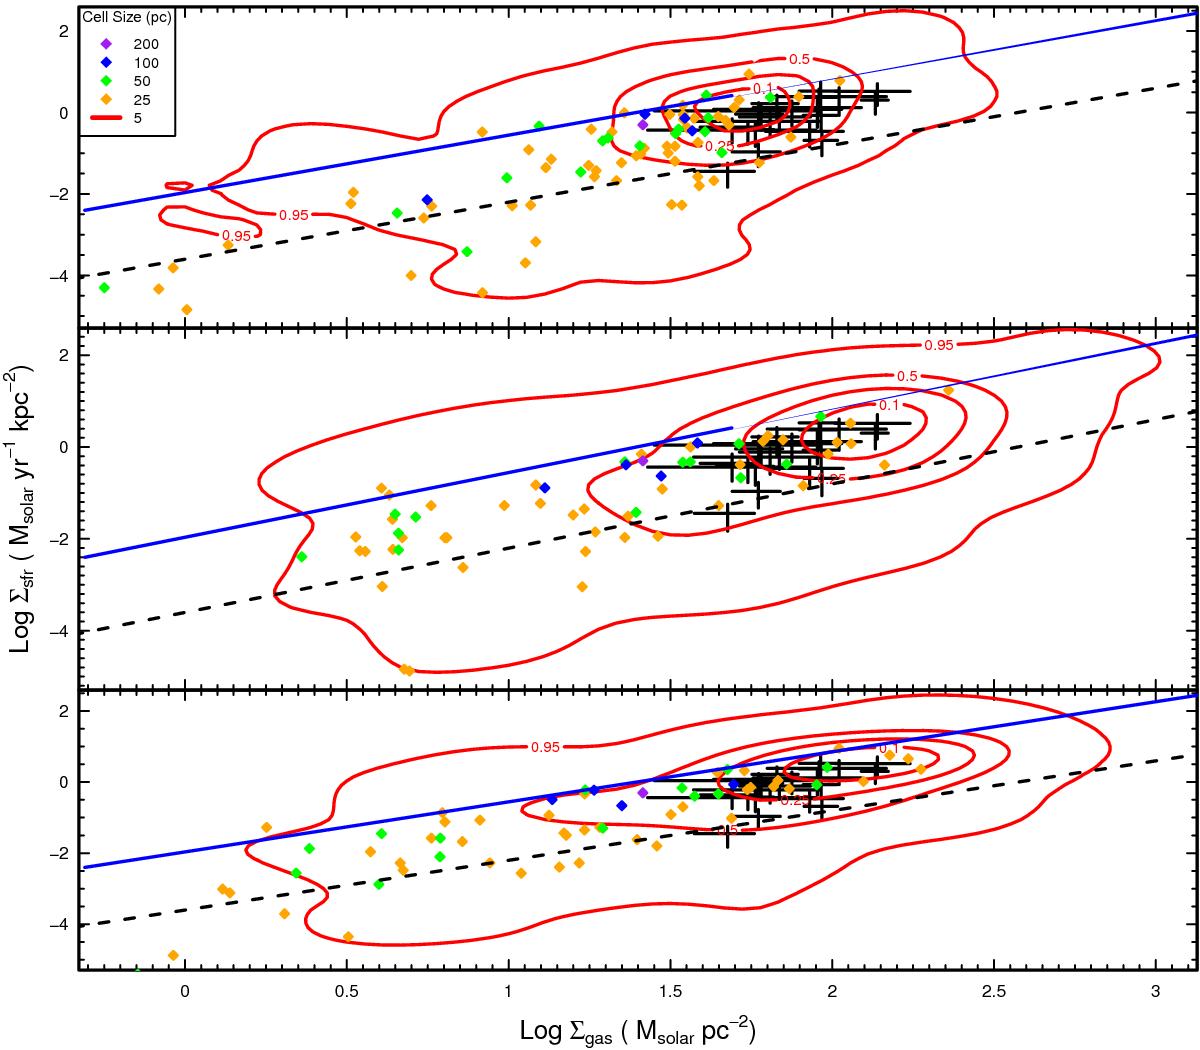
Surface densities of the star formation rates are plotted as a function of the surface densities of the neutral gas. The three panels represent the simulation as viewed along the three principle axes of the simulation grids. Crosses are observed data from Table 1 of Heiderman et al. (2010) with the extent of the cross indicting the confidence interval of the data. Coloured points (see key in top left) show the effects of increasing the cell size up to the size of the entire region (200 pc). The dashed line shows the observed extragalactic power-law relation from (Kennicutt 1998) and the blue line the power law fit achieved by Bonnell et al. (2013) to the Gravity simulation without PI feedback.
Current usage metrics show cumulative count of Article Views (full-text article views including HTML views, PDF and ePub downloads, according to the available data) and Abstracts Views on Vision4Press platform.
Data correspond to usage on the plateform after 2015. The current usage metrics is available 48-96 hours after online publication and is updated daily on week days.
Initial download of the metrics may take a while.