Fig. 3
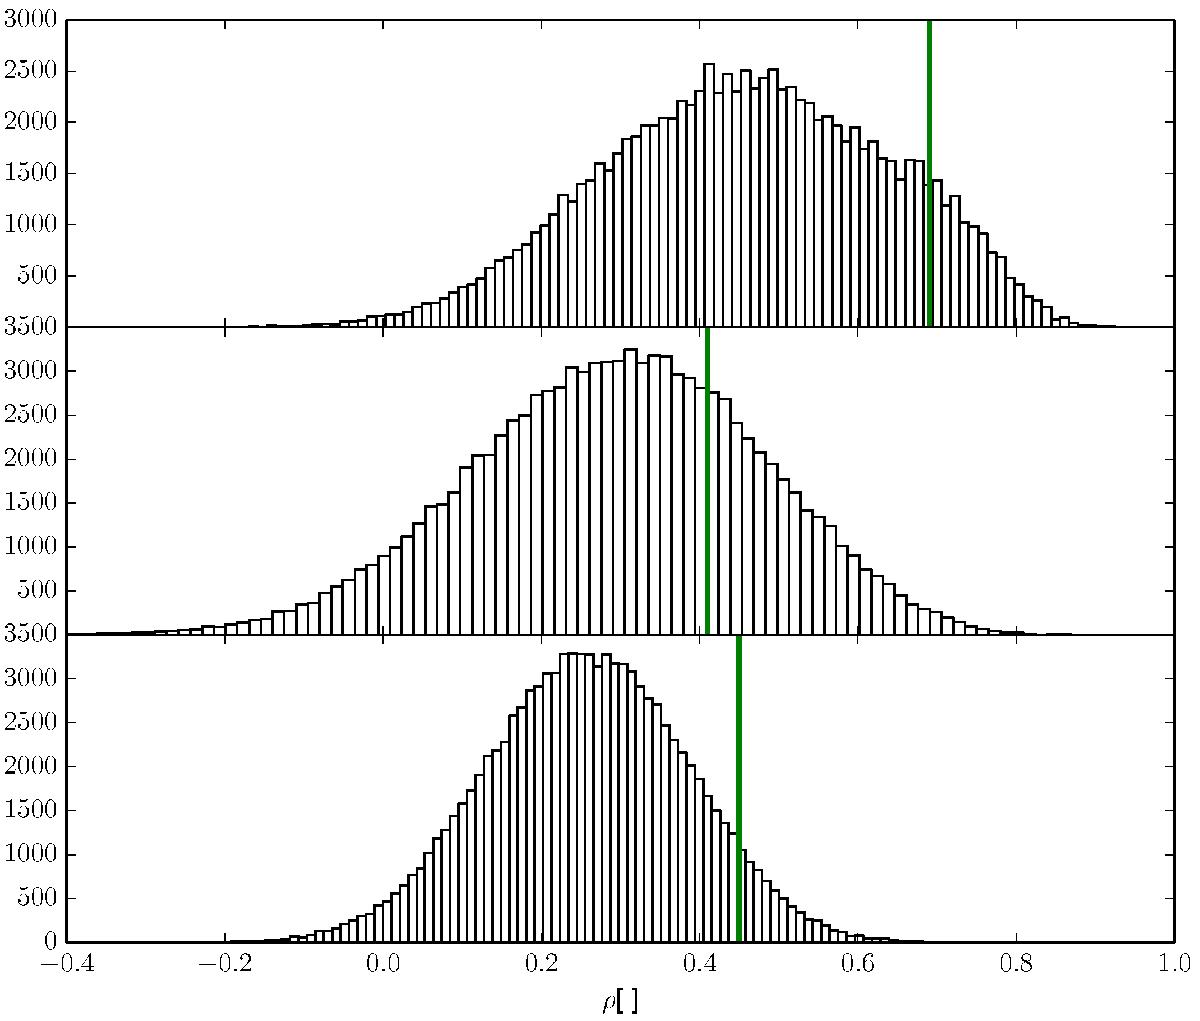
Spearman rank correlation coefficient for a mock population of log (![]() )-log (gp) pairs drawn from the 2014 data with the size of H10 dataset for the whole sample (upper panel), stars selected according to condition 1 (middle panel), and stars selected according to condition 2 (lower panel). The vertical lines represent the Spearman rank correlation coefficient values obtained using the set of stars presented in H10.
)-log (gp) pairs drawn from the 2014 data with the size of H10 dataset for the whole sample (upper panel), stars selected according to condition 1 (middle panel), and stars selected according to condition 2 (lower panel). The vertical lines represent the Spearman rank correlation coefficient values obtained using the set of stars presented in H10.
Current usage metrics show cumulative count of Article Views (full-text article views including HTML views, PDF and ePub downloads, according to the available data) and Abstracts Views on Vision4Press platform.
Data correspond to usage on the plateform after 2015. The current usage metrics is available 48-96 hours after online publication and is updated daily on week days.
Initial download of the metrics may take a while.