Fig. 2
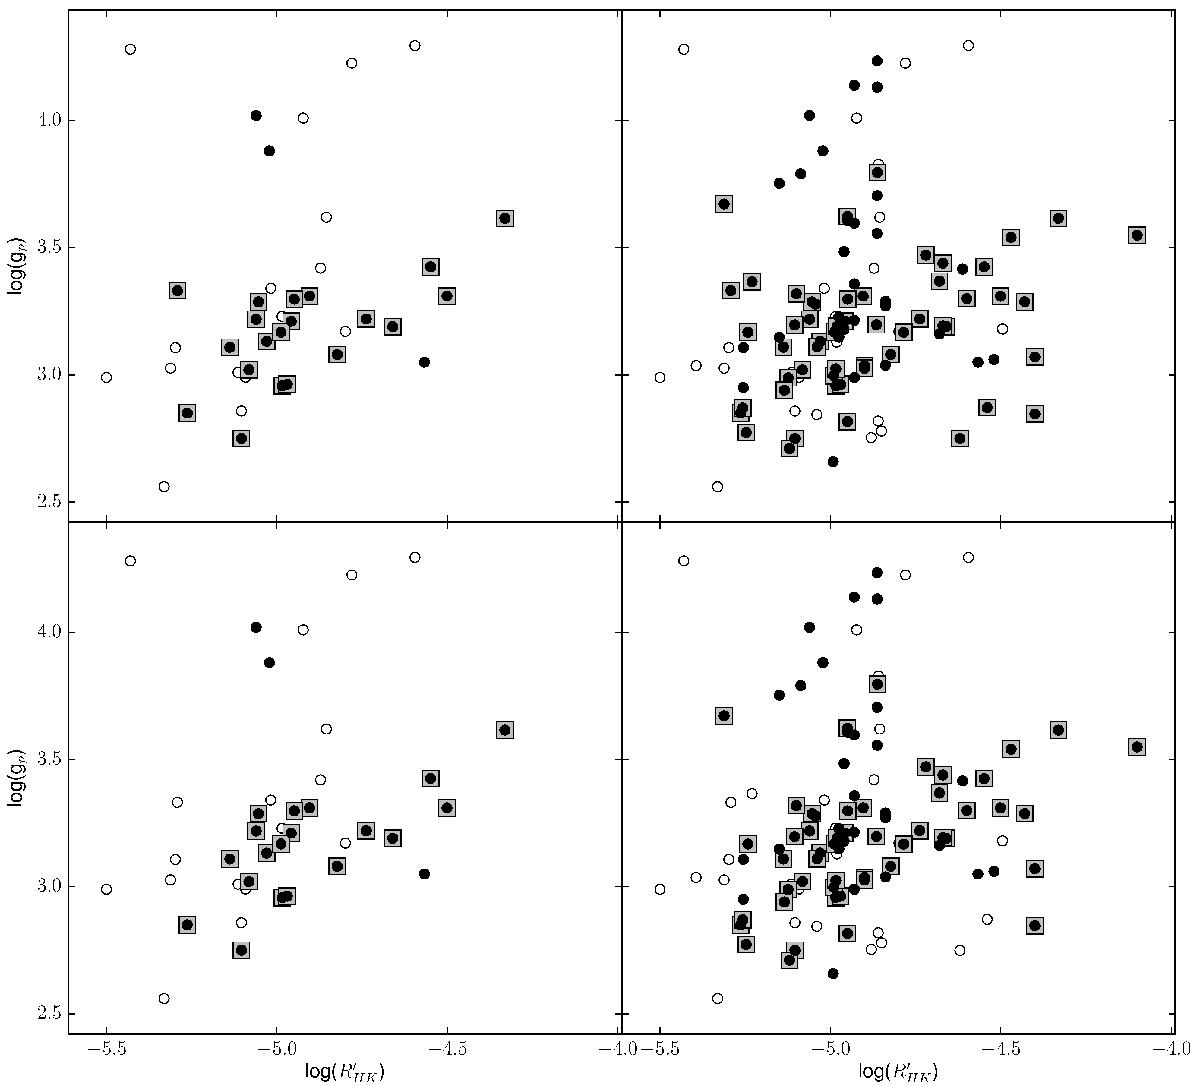
Planetary gravity log (gp) as a function of activity index log (![]() ) for the dataset studied in H10 alone (left panels) and the full one studied in this work (right panels). The two rows represent the conditions when using Teff from the literature (upper panels) and from the SWEET-Cat (lower panels); the markers represent the three conditions considered: squares represent condition 1, filled circles condition 2, and open circles the whole dataset, i.e., condition 3.
) for the dataset studied in H10 alone (left panels) and the full one studied in this work (right panels). The two rows represent the conditions when using Teff from the literature (upper panels) and from the SWEET-Cat (lower panels); the markers represent the three conditions considered: squares represent condition 1, filled circles condition 2, and open circles the whole dataset, i.e., condition 3.
Current usage metrics show cumulative count of Article Views (full-text article views including HTML views, PDF and ePub downloads, according to the available data) and Abstracts Views on Vision4Press platform.
Data correspond to usage on the plateform after 2015. The current usage metrics is available 48-96 hours after online publication and is updated daily on week days.
Initial download of the metrics may take a while.