| Issue |
A&A
Volume 572, December 2014
|
|
|---|---|---|
| Article Number | A1 | |
| Number of page(s) | 9 | |
| Section | Extragalactic astronomy | |
| DOI | https://doi.org/10.1051/0004-6361/201424347 | |
| Published online | 18 November 2014 | |
An X-ray and UV flare from the galaxy XMMSL1 J061927.1-655311
1
XMM SOC, ESAC, Apartado 78, 28691 Villanueva de la Cañada,
Madrid,
Spain
e-mail:
This email address is being protected from spambots. You need JavaScript enabled to view it.
2
Dept. of Physics and Astronomy, University of
Leicester, Leicester
LE1 7RH,
UK
3
Max-Planck Institut für Radioastronomie,
Auf dem Huegel 69, 53121
Bonn,
Germany
4
Centro de Astrobiología Depto. Astrofisica (INTA-CSIC), ESAC
campus, Apartado 78, 28691
Villanueva de la Cañada,
Spain
5
School of Physical Sciences, University of Tasmania,
7001
Hobart TAS,
Australia
6
Departamento de Astrofsica, Facultad de CC. Fsicas, Universidad
Complutense de Madrid, 28040
Madrid,
Spain
7
Research School of Astronomy and Astrophysics, Australian National
University, 2611
Canberra, ACT,
Australia
8
CSIRO Astronomy and Space Science, PO Box 76,
Epping
NSW
1710,
Australia
Received: 5 June 2014
Accepted: 22 September 2014
Abstract
Aims. New high variability extragalactic sources may be identified by comparing the flux of sources seen in the XMM-Newton Slew Survey with detections and upper limits from the ROSAT All Sky Survey.
Methods. A detected flaring extragalactic source was monitored with Swift and XMM-Newton to track its temporal and spectral evolution. Optical and radio observations were made to help classify the galaxy, investigate the reaction of circumnuclear material to the X-ray flare, and check for the presence of a jet.
Results. In November 2012, X-ray emission was detected from the galaxy XMMSL1 J061927.1-655311 (a.k.a. 2MASX 06192755-6553079), a factor 140 times higher than an upper limit from 20 years earlier. Both the X-ray and UV flux subsequently fell over the following year by factors of 20 and 4, respectively. Optically, the galaxy appears to be a Seyfert I with broad Balmer lines and weak, narrow, low-ionisation emission lines, at a redshift of 0.0729. The X-ray luminosity peaks at LX ~ 8 × 1043 erg s-1 with a typical Sy I-like power-law X-ray spectrum of Γ ~ 2. The flare has either been caused by a tidal disruption event or by an increase in the accretion rate of a persistent active galactic nucleus.
Key words: galaxies: active / galaxies: individual: XMMSL1 J061927.1-655311 / X-rays: galaxies
Bolton Fellow.
© ESO, 2014
1. Introduction
Galaxy nuclei showing large X-ray variability, in excess of a factor 100, are rare objects. In comparisons of the ROSAT (Trümper 1983) All Sky Survey (RASS; Voges 1999) and ROSAT pointed data, six such events were found out of the many thousands of galaxies observed. Of these, four (NGC 5905: Bade et al. 1996; RXJ 1242.6-1119: Komossa & Greiner 1999; RXJ 1420.4+5534: Greiner et al. 2000 and RXJ 1624.9+7554: Grupe et al. 1999) were interpreted as tidal disruption events (Hills 1975; Luminet 1985; Rees 1988) as they showed essentially no evidence for permanent active galactic nucleus (AGN) activity, and they faded in X-rays until they became undetectable. The other two (WPVS 007: Grupe et al. 1995a; IC 3599: Grupe et al. 1995b; Brandt et al. 1995; Komossa & Bade 1999) showed optical emission-line spectra of classical AGN and were interpreted as changes in emission or absorption from a persistent AGN.
The XMM-Newton Slew Survey (XSS; Saxton et al. 2008) represents a new opportunity to investigate high-amplitude flux changes in extragalactic sources on timescales of years. Three tidal disruption candidates (NGC 3599 and SDSS J1323+48: Esquej et al. 2007, 2008; SDSS J1201+30: Saxton et al. 2012) and one highly variable persistent AGN (GSN 069: Miniutti et al. 2013) have previously been reported.
In November 2012, XMM-Newton discovered strong X-ray emission coming from the vicinity of 2MASX 06192755-6553079; a galaxy that has not been detected previously in the RASS or other X-ray surveys. An upper limits analysis of the RASS data shows that the soft X-ray flux was at least 140 times higher in the XMM-Newton observation than it was 20 years earlier. Here we present an analysis of follow-up observations of this source.
The paper is structured as follows. In Sect. 2 we discuss the flare detection and source identification; in Sects. 3−5 we present X-ray, UV, optical and radio follow-up observations; in Sects. 6 and 7 we perform a temporal and spectral analysis of the source, and in Sect. 8 we assess whether the flare characteristics can be explained by an AGN or a TDE. The paper is summarised in Sect. 9.
A λCDM cosmology with (ΩM,ΩΛ) = (0.27, 0.73) and H0 = 70 km-1 s-1 Mpc-1 has been assumed throughout.
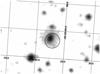 |
Fig. 1 Digitised sky survey r-filter image of the galaxy 2MASX 06192755-6553079, shown with the XMM-Newton slew error circle (8″ radius) and UVOT-enhanced Swift error circle (1.9″ radius; see text) centred on the detections. |
2. X-ray flare identification
During the slew 9236700005, performed on November 12th 2012, XMM-Newton (Jansen et al. 2001) detected a source, XMMSL1 J061927.1-655311 (hereafter XMMSL1 J0619-65), with an EPIC-pn, medium filter, 0.2–2 keV count rate of 2.1 ± 0.5 count s-1. This corresponds to a flux of F0.2−2 ~ 3.0 × 10⁻¹² erg s-1 cm-2 using a simple spectrum of a power law of index 2, absorbed by the Galactic column (see sections below) and a full-band flux F0.2−10 ~ 5 × 10-12 erg s-1 cm-2. We calculate a two-sigma upper limit from the RASS at this position of 0.0019 count s-1 (see Esquej et al. 2007, for a description of the upper limit calculation); a factor 140 lower flux using the same spectral model.
The source position lies 4.2″ from the galaxy 2MASX 06192755-6553079 (Skrutskie et al. 2006) which with J = 14.43 ± 0.10, H = 13.92 ± 0.14, K = 13.62 ± 0.20, R = 14.4 is the only bright optical and infrared source within the 8″ error circle (Saxton et al. 2008).
A crude analysis may be performed on the 21 photons in the slew spectrum to investigate the gross spectral properties of the detection. Detector matrices are calculated, taking into account the transit of the source across the detector, using a technique outlined in Read et al. (2008). The source has a power-law slope ~2, assuming no intrinsic absorption above the Galactic value of 4.4 × 1020 cm-2 (Kaberla et al. 2005).
3. X-ray and UV observations
An X-ray monitoring programme was initiated with Swift to follow the evolution of the source flux and spectrum. Snapshot 3 ks observations were made, initially once a week and then less frequently, with the Swift-XRT (Burrows et al. 2005) in photon counting mode and the UV optical telescope (UVOT; Roming et al. 2005), using the filter of the day. The Swift-XRT observations have been analysed following the procedure outlined in Evans et al. (2009) and the UVOT data have been reduced as described in Poole et al. (2008). An accurate position for the source in the Swift-XRT field can be determined by matching the UVOT field of view with the USNO-B1 catalogue and registering the XRT field accordingly (Goad et al. 2007). The resulting source position is then constrained to a one-sigma radius of 1.9″ and is coincident with the galactic nucleus (see Fig. 1).
In parallel, two 30 ks XMM-Newton pointed observations were triggered on 2012-12-15 (obsid = 0691100201) and 2013-04-20 (obsid = 0691100301). In each observation, the EPIC-pn and MOS-1 cameras were operated in full frame mode with the thin1 filter in place, while the MOS-2 camera was used in small window mode with the medium filter. The source was too faint for statistically significant data to be collected from the reflection grating spectrometers.
The XMM data were analysed with the XMM-Newton Science Analysis System (SAS v13.0.0; Gabriel et al. 2004). Light curves were extracted from the observations and searched for periods of high background flaring. The first observation was clean but the last 8 ks of the second observation were affected by strong background flares and were excluded from the analysis. A list of all X-ray observations and useful exposure times is given in Table 1.
X-ray observation log of XMMSL1 J0619-65.
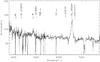 |
Fig. 2 AAOmega 2dF spectrum of XMMSL1 J0619-65 taken on 2012-12-03, after removal of narrow skyline features. |
4. Optical observations
We observed XMMSL1 J0619-65 with the AAOmega 2dF spectrograph (Saunders et al. 2004; Sharp et al. 2006) at the prime focus of the Anglo-Australian Telescope on 2012-12-03 for 3 × 600 s, in order to obtain an optical classification of the source and to search for transient emission lines excited by the flare. We used the 580V (3700−5800 A) and 385R (5600−8800 A) low-resolution gratings (R 1300). The 2dF data were reduced using the 2dFDR software of the AAO (e.g. Sharp & Birchall 2010) which performs bias subtraction, fibre flat fielding and wavelength calibration in an automated manner. The response curves for the blue and red arms were determined with an observation of several standards and were then used to obtain a relative flux calibration of the spectrum of XMMSL1 J0619-65. The blue spectrum was then renormalised to the B band (4500 Å) flux from the first XMM-Newton pointed observation of 2012-12-15 and the red spectrum scaled to match the blue in the overlapping area.
The spectrum shows broad Hα and Hβ and weak, narrow, low-ionisation Balmer lines and lines of [OIII], [NII] and [SII] (Fig. 2). In Table 2 we give the fluxes and relative intensities of detected emission lines. The diagnostic narrow line ratios [OIII]λ5007/Hβ = 3.1 ± 1.3; [NII]λ6583/Hα = 0.85 ± 0.15 and [SII]λλ6716, 6713/Hα = 1.0 ± 0.3, classify the source as an AGN (Veilleux & Osterbrook 1987) or place it, more precisely, on the boundary between a Liner and a Seyfert galaxy (Ho 2008). The FWHM of the Balmer lines and their strengths, relative to the narrow lines, identify this as a Seyfert I galaxy (Seyfert 1943). The source redshift as determined from the positions of narrow Hα and [NII] is z = 0.0729 ± 0.0002.
A second observation was made with the same detector configuration on 2013-10-18 for 1200 s. This shows the same qualitative line features as the first observation, namely broad Balmer lines and weak narrow lines. While a direct comparison of line fluxes, between the two observations, is prohibited by the lack of an absolute flux calibration for the second spectrum, a comparison of the broad Hα profiles can be made by normalising both spectra to the continuum (Fig. 3). The equivalent width of the broad Hα line is greater in the second observation. If the two profiles are subtracted, after normalisation to the continuum, then the residual profile has a width of FWHM ~ 3000 km s-1, intermediate between the very broad, FWHM ~ 6000 km s-1, component and the narrow line. Fitting the profiles separately, with a three-component model, gives a consistent strength for the very broad and narrow lines, while the medium width line doubles in intensity between the first and second observations.
Optical line widths and intensities for XMMSL1 J0619-65 from the AAOmega 2dF observation of 2012-12-03.
5. Radio observation
We observed XMMSL1 J0619-65 with the ATCA CABB system (Wilson et al. 2011) on 2013-01-21 for five hours staring at 07:35 UT, in order to detect possible jet emission related to the flare or to search for low-level radio emission from a permanent AGN. The array was in the 750C configuration. We observed with 2 GHz bandwidth for five bands centred at 2.1 GHz, 5.5 GHz, 9.0 GHz, 17 GHz and 19 GHz. The 2.1 GHz band was badly affected by RFI, so that only approximately 2.5 GHz was usable. We flagged and calibrated the data according to standard procedure in Miriad (Sault et al. 1995). We used PKS1934-638 as a primary calibrator for the lowest 3 bands, and PKS2221-052 for the upper two bands using 3.894 Jy at 17 GHz and 4.159 Jy at 19 Ghz. Regular phase calibration scans were taken of the nearby calibrator (0515-674) for the lower three bands, and 0623-6436 for the upper two bands. We obtained 3−4 cuts per band at roughly equally spaced hour angles over five hours.
As the array was in a relatively short configuration, with a large gap in uv coverage between the first five antennas and antenna 6, we removed antenna 6 during the imaging. Images were made with multifrequency synthesis and natural weighting to maximise sensitivity to point sources, and cleaned with multifrequency clean. For the 5.5 and 9 GHz data, we also performed one round phase self-calibration based on point sources that were in the field.
XMMSLJ0619-6553 was not detected in any band above five sigma. The five-sigma upper limits were 2.1 GHz: 984 μJy; 5.5 GHz: 110 μJy; 9.0 GHz: 150 μJy; 17 GHz: 340 μJy; 19 GHz: 486 μJy.
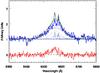 |
Fig. 3 Comparison of the Hα profile of the two AAOmega 2dF spectra of XMMSL1 J0619-65 taken on 2012-12-03 (blue) and 2013-10-18 (green). Both spectra have been normalised to their respective continua. The dotted lines represent fits of a multi-component (very broad, broad and narrow lines) model (see text). The lower panel shows the difference spectrum produced when subtracting the normalised 2012-12-03 profile from that of 2013-10-18. |
6. X-ray and UV variability
In Fig. 4 we show the historical X-ray light curve for XMMSL1 J0619-65. Around 2012-11-12 the source flux apparently peaked, reaching a value 140 times higher than an upper limit that can be derived from RASS data taken in 1990. It then experienced a decline of a factor 20 while continuing to exhibit variability of a factor few between monthly observations.
In Fig. 5 we show the short-term light curve from the two XMM-Newton pointed observations. The X-ray flux shows small variations, with an amplitude up to 25%, on timescales of a few thousand seconds.
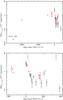 |
Fig. 4 0.2–2 keV X-ray light curve of XMMSL1 J0619-65. Upper: the full historical light-curve, lower: a zoom into the more recent data. The symbols are: XSS (red diamonds or arrows for upper limits), XMM-Newton pointed observations (red triangles), Swift-XRT (black squares), ROSAT upper limit (blue arrow). The blue dotted vertical lines indicate the dates of the optical observations. |
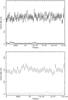 |
Fig. 5 Background subtracted, exposure corrected, EPIC-pn, 0.2−10 keV, light curves and area-normalised background, for the 2012-12-15 (top) and 2013-04-24 (bottom) XMM-Newton pointed observations. |
6.1. UV light curve
During the two pointed XMM-Newton observations, the optical monitor (OM) cycled between the B, U, UVW1 and UVM2 filters. Swift-UVOT observations were performed with the filter of the day, either the uv, uvw1, uvm2 or uvw2 filters, except for the last observation of 2013-12-04 which cycled through all the filters. The galaxy was detected in all of the filters. Relative filter fluxes were determined using several nearby sources of comparable brightness as references. The absolute flux scale was taken from the Swift-UVOT filters, with XMM-Newton-OM points scaled to these by filter-dependent factors of ~2–3, using the technique outlined in Grupe et al. (2008).
In Fig. 6 we see that the flux, in all the UV filters, has responded to a strong flare coeval with the X-ray peak. After the flare the UV flux declined in all the filters, with the better monitored U band (3480 Å) reducing by a factor 4.2 ± 0.3 or 1.56 ± 0.08 mag in 374 days.
Galex observed the galaxy on 2007-03-03 finding an NUV (2267 Å) flux of 1.7 ± 0.2 × 10⁻¹⁶ erg s-1 cm-2 Å-1 and FUV (1516 Å) flux of 2.6 ± 0.3 × 10⁻¹⁶ erg s-1 cm-2 Å-1. It reobserved the galaxy in the NUV only on 2011-10-26 and found a consistent flux. The NUV filter has a similar bandpass to the uvw2 filter and its flux is close to that of the third and fouth observations made by Swift with that filter.
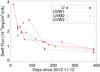 |
Fig. 6 UV light curve of XMMSL1 J0619-65 taken from the Swift-UVOT and XMM-Newton-OM observations using the filters: U (3480 Å), UVW1 (2950 Å), UVW2 (2120 Å) and UVM2 (2340 Å). |
6.2. X-ray spectral analysis
We performed a spectral analysis of the two XMM-Newton pointed observations, taken 34 and 159 days after the peak flux seen on 2012-11-12 (see Fig. 4). We extracted spectra for the three XMM-Newton EPIC cameras with the XMM-Newton SAS task especget which uses optimum extraction regions and a local background. Fits were performed simultaneously on the ungrouped spectra, using the Cash statistic (Cash 1979), over the energy range 0.3−10 keV, using a constant to account for the small differences in normalisation between the instruments. The first XMM-Newton pointed observation (hereafter XMM1) had 31200 background subtracted counts in the three cameras and in this energy range, while the second pointed observation (hereafter XMM2) had 12300 background subtracted counts. Quoted errors are 90% confidence unless otherwise stated.
We applied a series of spectral models to XMM1 and XMM2 both separately and jointly. As a first step we fit the XMM1 observation with a simple power-law model and galactic absorption of 4.4 × 1020 cm-2. The fit is reasonably good (C/d.o.f. = Cr = 3612/3230) and yields a slope of 1.96 ± 0.02 consistent with a typical Seyfert I spectrum (e.g. Nandra & Pounds 1994). Fitting in the 0.3–2 keV and 2–10 keV ranges independently gives slopes of 2.1 ± 0.03 and 1.80 ± 0.03 respectively, showing that there is curvature in the spectrum (see Fig. 7). We tried to model the curvature as a low-energy excess attributable to a thermal plasma or more successfully to a black-body. The latter improved the fit (Cr = 3490/3228) and gave a temperature,  eV, consistent with the ubiquitous 100−200 eV seen when fitting the soft excess of a wide range of AGN (Gierlinski & Done 2004). Residuals remain around 6 keV which can be modelled by a narrow gaussian with energy fixed at 6.4 keV in the source rest frame; further improving the fit (Cr = 3480/3227) and giving a line strength of
  photons cm-2 s-1 and equivalent width of
  eV.
eV.
XMM2 has a count rate 2.5 times lower than XMM1. Independently fitting a power law in the ranges 0.3−2 keV and 2−10 keV yields slopes of 1.88 ± 0.04 and 1.79 ± 0.09 implying that the spectral shape has changed (Fig. 7). The simple power-law plus black-body model is also improved for XMM2 by the addition of a narrow Fe Kα line of strength  photons cm-2 s-1 and equivalent width of
  eV.
eV.
An F-test gives a probability of 99.8% and 96.1% that the addition of the Fe line to the XMM1 and XMM2 observations is significant, although we note the problem with applying the test in this context (Protassov et al. 2002).
To quantify how the spectral shape changes between observations we apply an absorbed power law with a black-body of temperature kT = 120 eV model to all of our X-ray spectra, including the Swift observations. This gives the relationship between flux and spectral hardness shown in Fig. 8. There is no obvious correlation with flux, within the errors. Possibly the source has hardened with time and then subsequently softened.
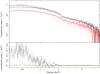 |
Fig. 7 Comparison of EPIC-pn spectra from the XMM-Newton pointed observations of 2012-12-15 (black) and 2013-04-20 (red). The lower panel presents residuals to independent fits of a power-law model, absorbed by the Galactic column, to the 2−10 keV data of each spectrum. |
 |
Fig. 8 Ratio of the 2−10 keV to 0.2−2.0 keV flux, calculated by fitting a phenomenological model of a power-law plus a black-body of kT = 120 eV absorbed by the Galactic column, as a function of the (absorbed) X-ray (0.2–10 keV) flux (upper) and observation date (lower). |
To consistently describe the neutral iron emission line and the spectral curvature we added a model for reflection from distant material. We adopted the pexmon model (Nandra et al. 2007), which considers Compton reflection and the Fe Kα, Fe Kβ and Ni Kα flourescence lines, fixing abundances to the solar values. The inclination angle was essentially unconstrained in fits and was fixed to 45°. Figure 7 suggests that, while the continuum above 2 keV varies mainly in normalisation between the two observations, there has been a large change in the shape of the soft spectrum below 2 keV. This can be modelled as either an increase in absorption or as a decrease in a discrete soft emission component between the XMM1 and XMM2 observations. In Table 3 we test these possibilities with fits to the individual and combined observations. For absorption we use a partially covering, ionised absorber (zxipcf in XSPEC; Reeves et al. 2008). The alternative, additional soft emission component, was modelled by reflection from an ionised disk (reflionx in XSPEC; Ross & Fabian 2005) which is relativistically blurred (kdblur in XSPEC; Laor 1991; Fabian et al. 2002). We fixed the relative Fe abundance to the solar value and the power-law slope to the index of the primary continuum. The fit statistic was found to have little dependence on the parameters of the blurring model and these were fixed to, emissivity index = 3; inner radius = 4.5 GM/c2; outer radius = 100 GM/c2 and inclination = 45°. In fits to the individual observations, the two models fit XMM1 equally well while the absorption model gives a somewhat better fit to XMM2 (Cr = 3040/3226 compared with Cr = 3055/3227).
In order to better constrain the changes between XMM1 and XMM2 we fit the two spectra simultaneously. First we looked if a simple variation of the intensity of the primary power law, with fixed reflection and absorption could explain the data. This gave a fit statistic of Cr = 6622/6457. Then we forced the primary power law and distant reflection components to be constant between the two observations and allowed the absorption alone to vary, which improved the fit to Cr = 6575/6455. Repeating this fit but also allowing the power-law normalisation to vary reduced the statistic to Cr = 6528/6454. Finally we fixed the power-law slope and distant reflection components and allow the power-law normalisation and the reflection from the disk to vary, yielding a fit parameter of Cr = 6557/6455. In this case the best fit yields a reduction in the power-law normalisation and an even greater reduction in the reflection normalisation. We note that this disagrees with the light-bending model (Miniutti & Fabian 2004) which argues that a reduction in power-law emission occurs due to an increase in rays which are intercepted by the disk; a mechanism which naturally leads to an increase in disk emission.
Spectral fits to XMM-Newton pointed observations of XMMSL1 J0619-65.
7. Broadband SED
In Fig. 9 we plot the spectral energy distribution (SED) of the source. A measure of the relative X-ray strength can be found from the optical to X-ray slope, defined in Just et al. (2007) as 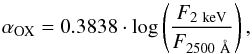 (1)where F2 keV and F2500 Å are the monochromatic fluxes at 2 keV and 2500 Å respectively. For the XMM-Newton observation of 2012-12-15 we take the flux at 2500 Å from the XMM-Newton-OM UVM2 filter and find αOX = −0.96. This is flatter than usual but still consistent, within the one-σ error bounds, with the correlation found by Steffen et al. (2006) for a sample of moderate-luminosity optically-selected AGN. Nevertheless, the SED shows no indication of a “big-blue-bump” either in the soft X-rays or in the UV and appears to be relatively X-ray bright. In this respect it resembles the SED of a low-luminosity AGN, rather than that of a quasar (see Nemmen et al. 2014; Scott & Stewart 2014).
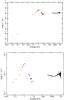 |
Fig. 9 Galactic-absorption corrected spectral energy distribution of XMMSL1 J0619-65. Data are, from low to high energy, ATCA (green), WISE (orange), 2MASS (red), XMM-Newton-OM (blue), Galex (pink) and XMM-Newton EPIC-pn (black). The Galex points were taken in 2007, likely during a slightly lower luminosity state than the XMM-Newton measurements of 2012-12-15. The lower panel shows a zoom into the IR-X-ray data. |
8. Discussion
From the relationship of black hole mass to bulge K-band luminosity (Marconi & Hunt 2003) we find MBH ~ 107 M⊙ from the point source 2MASS magnitude of mK = 14.2. From the broad Hα luminosity and width we find a value of MBH ~ 3 × 10⁷ M⊙ (Greene & Ho 2005). We can also estimate MBH from the relationship between the broad Hβ line width and the distance of the BLR gas such that MBH = fG-1RBLRΔν2. From the first AAT spectrum we find λLλ(5100 Å) = 1043 erg s-1 which, from the correlation and dispersion between λLλ(5100 Å) and RBLR for low-luminosity AGN given in Bentz et al. (2013) gives RBLR = 10 ± 5 light days. From this we obtain MBH = 6 ± 3 × 10⁷ M⊙. An MBH of a few × 107 M⊙ is qualitatively supported by the lack of fast variability seen in the XMM-Newton light curves.
At peak, the unabsorbed 0.2-10 keV luminosity was L0.2−10 ~ 8 × 1043 erg s-1 and L2−10 ~ 3 × 1043 erg s-1. This implies a bolometric luminosity of Lbol,peak ~ 7 × 1044 erg s-1 applying the scaling relations of Vasudevan et al. (2009) or Lusso et al. (2011), appropriate for a Sy I. The SED implies an unusually weak big-blue bump in this source and the X-ray bolometric correction seen in LLAGN of κX ~ 10 (Vasudevan & Fabian 2007; Lusso et al. 2011; Nemmen et al. 2014) may be more appropriate here yielding Lbol,peak ~ 3 × 1044 erg s-1. The ratio of the peak 2−10 keV luminosity to that of [OIII] λ5007, LX/LOIII ~ 3000, is in excess of the ratio ~1−100 usually seen in samples of Seyfert galaxies (Panessa et al. 2006; Lamastra et al. 2009).
8.1. Variability between observations
Now we investigate the X-ray and UV variability seen between 2012-11-12 and 2013-12-04. From the X-ray spectra alone it is not simple to distinguish between variable emission and variable absorption. Here we do not have the benefit of occultation events such as those seen in ESO 362-G18 (Agis-Gonzalez et al. 2014) or ESO 323-G77 (Miniutti et al. 2014) to help decide the question. If we assume constant emission from the direct power law and reflection components in the two XMM-Newton observations then an increase in absorption of NH ~ 1024 cm-2 and covering fraction from ~40 to ~70% is needed to explain the observed flux and spectral change. The extra absorbing cloud(s) must be dusty to also cause the drop seen in the UV flux and hence must be placed at or beyond the BLR. However, if the intrinsic emission is also allowed to vary, then a better fit (ΔC = 47 for 1 d.o.f.) is provided by a reduction in the power-law emission of a factor 3 and a reduction in absorption by 2−10 × 1023 cm-2. Alternatively, a reduction in intrinsic power-law emission of a factor 2.4 and a destruction of a disk reflection component also provides a better (ΔC = 18 for 0 d.o.f.) fit to the joint spectra than a pure increase in absorption (Table 3). Hence, the spectral evidence favours the idea that the variability, on a timescale of months, is due to a decrease in intrinsic emission rather than an increase in absorption.
8.2. Long-term variability
The factor ≥140 increase in historical soft X-ray flux is also difficult to explain by changing line-of-sight absorption. MKN 335 exhibits large variations in X-ray flux and spectral shape on timescales of months and years (Grupe et al. 2012; Longinotti et al. 2013), with uncorrelated strong UV flux changes on a similar timescale. These variations occur in the sense that LX measured at the peak X-ray flux is consistent with the strong narrow [OIII]λ5007 luminosity. Whereas, when the X-ray flux is low it underpredicts L[ OIII ] and can be said to be in an X-ray weak state. Similar behaviour is seen in PHL 1092 (Miniutti et al. 2009) although in that case without parallel UV variability and in PG 2112+059 (Schartel et al. 2010). Whether the flux responds to varying absorption (Grupe et al. 2012) or a variable disk reflection (Miniutti et al. 2009; Gallo et al. 2013) is still an open question but in either case the behaviour of these AGN is different to that of XMMSL1 J0619-65, which was X-ray loud when at peak.
Under the assumption then that XMMSL1 J0619-65 has undergone a recent increase in luminosity, we discuss below the likelihood of the change being caused by the tidal disruption of a stellar object or by a change in the accretion state of a persistent AGN.
8.3. Tidal-disruption event
The disruption of a stellar object by gravitational sheer has been invoked to explain high luminosity flares seen in the nuclei of several quiescent galaxies in the soft X-ray (Bade et al. 1996; Komossa & Bade 1999; Komossa et al. 2004; Esquej et al. 2007), UV (Gezari et al. 2006, 2009, 2012) and optical bands (Komossa et al. 2009; van Velzen et al. 2011; Cenko et al. 2012). In X-ray selected TDE, the X-ray spectrum is usually soft (Γ > 3) and thought to be the Wien tail of a (lightly reprocessed) thermal spectrum which peaks in the EUV. Occasionally, tidal disruption candidates do show a harder peak X-ray spectrum more typical of a standard AGN. PTF10iya (Cenko et al. 2012) showed a strong optical flare accompanied by an X-ray flare with a power-law spectrum of slope  , similar to that seen in XMMSL1 J0619-65. The optical and X-ray spectra of PTF10iya cannot be fit simultaneously with a single spectral model, suggesting that, while clearly part of the same event, if they were produced by a tidal disruption then they represent different reprocessed spectral components of the original thermal photons. A well-monitored X-ray flare in the nearby Sy II galaxy, NGC 4548, which also resulted in a flat (Γ ~ 2.2) power-law spectrum, has also been attributed to a tidal disruption event (Nikolajuk & Walter 2013). In this case the X-ray flux reduced by a factor ~500 in 18 months but at peak was a factor 103 higher than the value expected from the relationship between LX and L[ OIII ]. Both of these sources do show signs of weak AGN activity in their optical spectra. Transient, super-strong emission lines of hydrogen, helium and highly ionised Iron, indicated a luminous X-ray flare in SDSS J095209.56+214313.3 (Komossa et al. 2008, 2009) of which only the low-energy (UV, optical, NIR) variability was observed near the high state. Its X-ray emission, observed a few years after peak was also relatively hard (Γ ~ 2).
The flat X-ray spectrum, seen in XMMSL1 J0619-65, initially suggested that we might have seen a similar event to SWIFT J164449.3+573451 (Burrows et al. 2011; Bloom et al. 2011; Zauderer et al. 2011), where an on-axis jet dominated the radio and X-ray emission. The stringent limits on radio emission, discussed in Sect. 5, effectively exclude the presence of a strong jet in XMMSL1 J0619-65. If an off-axis jet was launched, by the accretion of tidally disrupted material then it should radiate strongly in the radio band when it interacts with the interstellar medium and forms a reverse shock (Giannios & Metzger 2011). The radio emission is predicted to peak after ~1 year, at ν ~ 25 GHz, with a flux of ~2(D/GPc)2 mJy for a moderately energetic jet . At the distance of XMMSL1 J0619-65 (330 Mpc) the predicted fluxes at 5.5 and 19 GHz are 10.8 and 16.4 mJy respectively. The XMMSL1 J0619-65 five-σ upper limits taken 14 months after discovery are a factor 98 and 34 below these values which suggests that a jet was not launched during this event. Note that the strict radio limits also make it unlikely that the event was due to a flare in a persistent Blazar.
If XMMSL1 J0619-65 is a TDE then its flux should continue to reduce over the coming years.
8.4. High-amplitude variability of AGN
Variability of AGN by factors of a few to 20 is not uncommon, and is typically traced back to changes in the line-of-sight (cold or ionised) absorption (e.g., Risaliti et al. 2005), by changes in emission and reflection mechanisms (e.g., Fabian et al. 2012) or by small pertubations in the accretion rate (McHardy et al. 2006).
In the X-ray variability selected galaxy, GSN 069, Miniutti et al. (2013) found a current accretion rate 25 times higher than the historical value and a spectrum which appears to be dominated by emission from the accretion disk suggesting that there has been a change in the accretion disk structure within the last 20 years. Perhaps the closest analogy to the XMMSL1 J0619-65 event is that seen in NGC 2617 (Shappee et al. 2014). This galaxy recently showed an X-ray and nearly-simultaneous UV flare with an apparent increase in bolometric luminosity of a factor of a few hundred. The X-ray spectrum was flat (Γ = 1.7) and the optical spectrum shows signs of the flare, changing from a Sy 1.8 classification to that of a Sy 1.
If XMMSL1 J0619-65 is an AGN, i.e. a SMBH which is being persistently fueled, then together with NGC 2617, it represents a relatively fast (≲20 years) change in the accretion rate whose mechanism remains to be explained.
9. Summary
A UV and X-ray flare has been seen in the galaxy XMMSL1 J0619-65. The increased luminosity has either been caused by a tidal disruption event or by an increase in the accretion rate of a persistent AGN. The discovery of variability events such as XMMSL1 J0619-65, NGC 2617 and NGC 4548 provide new insights into accretion onto black holes and may eventually lead to an observational framework that can be used to distinguish between a tidal disruption and AGN variability, in galaxies which do show signs of AGN activity in their optical spectra. In this respect, surveys like the XSS are important to find further examples of these rare events.
Acknowledgments
We thank the XMM OTAC for approving this programme. The XMM-Newton project is an ESA science mission with instruments and contributions directly funded by ESA member states and the USA (NASA). The XMM-Newton project is supported by the Bundesministerium für Wirtschaft und Technologie/Deutches Zentrum für Luft- und Raumfahrt i (BMWI/DLR, FKZ 50 OX 0001), the Max-Planck Society and the Heidenhain-Stiftung. We thank the Swift team for approving and performing the monitoring observations. This work made use of data supplied by the UK Swift Science Data Centre at the University of Leicester. We thank the ATCA director for approving our DDT request and the new director of the AAT for granting director’s time for the second optical observation. A.M.R. acknowledges the support of STFC/UKSA/ESA funding. R.D.S. would like to gratefully acknowledge the support and enthusiasm of the late Martin Turner during his introduction to AGN.
References
- Agis-Gonzalez, B., Miniutti, G., Kara, E., et al. 2014, MNRAS, 443, 2862 [NASA ADS] [CrossRef] [Google Scholar]
- Bade, N., Komossa, S., & Dahlem, M. 1996, A&A, 309, L35 [NASA ADS] [Google Scholar]
- Bentz, M., Denney, K., Grier, C., et al. 2013, ApJ, 767, 149 [NASA ADS] [CrossRef] [Google Scholar]
- Bloom, J., Giannios, D., Metzger, B. D., et al. 2011, Science, 333, 203 [CrossRef] [PubMed] [Google Scholar]
- Brandt, W., Pounds, K., & Fink, H. 1995, MNRAS, 273, L47 [NASA ADS] [CrossRef] [Google Scholar]
- Burrows, D., Hill, J., Nousek, J., et al. 2005, Space Sci. Rev., 120, 165 [NASA ADS] [CrossRef] [Google Scholar]
- Burrows, D., Kennea, J., Ghisellini, G., et al. 2011, Nature, 476, 421 [NASA ADS] [CrossRef] [PubMed] [Google Scholar]
- Cash, W. 1979, ApJ, 228, 939 [NASA ADS] [CrossRef] [Google Scholar]
- Cenko, S., Bloom, J., Kulkarni, S., et al. 2012, MNRAS, 420, 2684 [NASA ADS] [CrossRef] [Google Scholar]
- Esquej, P., Saxton, R., Freyberg, M., et al. 2007, A&A, 462, L49 [NASA ADS] [CrossRef] [EDP Sciences] [Google Scholar]
- Esquej, P., Saxton, R. D., Komossa, S., Read, A. M., & Freyberg, M. J. 2008, A&A, 489, 543 [NASA ADS] [CrossRef] [EDP Sciences] [Google Scholar]
- Evans, P., Beardmore, A., Page, K., et al. 2009, MNRAS, 397, 1177 [NASA ADS] [CrossRef] [Google Scholar]
- Fabian, A., Ballantyne, D., Merloni, A., et al. 2002, MNRAS, 331, L35 [NASA ADS] [CrossRef] [Google Scholar]
- Fabian, A., Zoghbi, A., Wilkins, D., et al. 2012, MNRAS, 419, 116 [NASA ADS] [CrossRef] [Google Scholar]
- Gabriel, C., Denby, M., Fyfe, D. J., et al. 2004, In ADASS XIII, eds. F. Oschenbein, M. Allen, & D. Egret, ASP Conf. Ser., 314, 759 [Google Scholar]
- Gallo, L., Fabian, A., Grupe, D., et al. 2013, MNRAS, 428, 1191 [NASA ADS] [CrossRef] [Google Scholar]
- Gierlinsky, M., & Done, C. 2004, MNRAS, 349, L7 [NASA ADS] [CrossRef] [Google Scholar]
- Gezari, S., Martin, D., Milliard, B., et al. 2006, ApJ, 653, L25 [NASA ADS] [CrossRef] [Google Scholar]
- Gezari, S., Heckman, T., Cenko, S., et al. 2009, ApJ, 698, 1367 [NASA ADS] [CrossRef] [Google Scholar]
- Gezari, S., Chornock, R., Rest, A., et al. 2012, Nature, 485, 217 [NASA ADS] [CrossRef] [PubMed] [Google Scholar]
- Giannios, D., & Metzger, B. 2011, MNRAS, 416, 2102 [NASA ADS] [CrossRef] [Google Scholar]
- Goad, M., Tyler, L., Beardmore, A., et al. 2007, A&A, 476, 1401 [NASA ADS] [CrossRef] [EDP Sciences] [Google Scholar]
- Greene, J., & Ho, L. 2005, ApJ, 630, 122 [NASA ADS] [CrossRef] [Google Scholar]
- Greiner, J., Schwarz, R., Zharikov, S., Orio, M. 2000, A&A, 362, L25 [NASA ADS] [Google Scholar]
- Grupe, D., Beuerman, K., Mannheim, K., et al. 1995a, A&A, 300, L21 [NASA ADS] [Google Scholar]
- Grupe, D., Beuerman, K., Mannheim, K., et al. 1995b, A&A, 299, L51 [Google Scholar]
- Grupe, D., Thomas, H.-C., Leighly, K. 1999, A&A, 350, L31 [NASA ADS] [Google Scholar]
- Grupe, D., Komossa, S., Gallo, L., et al. 2008, ApJ, 681, 982 [NASA ADS] [CrossRef] [Google Scholar]
- Grupe, D., Komossa, S., Gallo, L. 2012, ApJS, 199, 28 [NASA ADS] [CrossRef] [Google Scholar]
- Hills, J. 1975, Nature, 254, 295 [NASA ADS] [CrossRef] [Google Scholar]
- Ho, L. 2008, ARA&Av, 46, 475 [NASA ADS] [CrossRef] [Google Scholar]
- Jansen, F., Lumb, D., Altieri, B., et al. 2001, A&A, 365, L1 [NASA ADS] [CrossRef] [EDP Sciences] [Google Scholar]
- Just, D., Brandt, W., Shemmer, O., et al. 2007, ApJ, 665, 1004 [Google Scholar]
- Kalberla, P., Burton, W., Hartmann, D., et al. 2005, A&A, 440, 775 [NASA ADS] [CrossRef] [EDP Sciences] [Google Scholar]
- Komossa, S., & Bade, N. 1999, A&A, 343, 775 [NASA ADS] [Google Scholar]
- Komossa, S., & Greiner, J. 1999, A&A, 349, L45 [NASA ADS] [Google Scholar]
- Komossa, S., Halpern, J., Schartel, N., et al. 2004, ApJ, 603, L17 [NASA ADS] [CrossRef] [Google Scholar]
- Komossa, S., Zhou, H., Wang, T., et al. 2008, ApJ, 678, 13 [Google Scholar]
- Komossa, S., Zhou, H., Rau, A., et al. 2009, ApJ, 701, 105 [NASA ADS] [CrossRef] [Google Scholar]
- Laor, A. 1991, ApJS, 125, 317 [Google Scholar]
- Lamastra, A., Bianchi, S., Matt, G., et al. 2009 A&A, 504, 73 [NASA ADS] [CrossRef] [EDP Sciences] [Google Scholar]
- Longinotti, A. L., Krongold, Y., & Kriss, G. 2013, ApJ, 766, 104 [NASA ADS] [CrossRef] [Google Scholar]
- Luminet, J.-P. 1985, AnPh, 10, 101 [NASA ADS] [Google Scholar]
- Lusso, E., Comastri, A., Vignali, C., et al. 2011, A&A, 534, 110 [Google Scholar]
- Marconi, A., & Hunt, L. 2003, ApJ, 589, L21 [NASA ADS] [CrossRef] [Google Scholar]
- McHardy, I., Koerding, E., Knigge, C., Uttley, P., & Fender, R. P. 2006, Nature, 444, 730 [NASA ADS] [CrossRef] [PubMed] [Google Scholar]
- Miniutti, G., & Fabian, A. 2004, MNRAS, 349, 1435 [NASA ADS] [CrossRef] [Google Scholar]
- Miniutti, G., Fabian, A., Brandt, W., Gallo, L., & Boller, Th. 2009, MNRAS, 396, 85 [Google Scholar]
- Miniutti, G., Saxton, R., Rodríguez-Pascual, P., et al. 2013, MNRAS, 433, 1764 [NASA ADS] [CrossRef] [Google Scholar]
- Miniutti, G., Sanfrutos, M., Beuchert, T., et al. 2014, MNRAS, 437, 1776 [NASA ADS] [CrossRef] [PubMed] [Google Scholar]
- Nandra, K., & Pounds, K. 1994, MNRAS, 267, 193 [NASA ADS] [CrossRef] [Google Scholar]
- Nandra, K., O’Neill, P., George, I., & Reeves, J. 2007, MNRAS, 382, 194 [NASA ADS] [CrossRef] [Google Scholar]
- Nemmen, R., Storchi-Bergmann, T., & Eracleous, M. 2014, MNRAS, 438, 2804 [NASA ADS] [CrossRef] [Google Scholar]
- Nikolajuk, M., & Walter, R. 2013, A&A, 552, A75 [NASA ADS] [CrossRef] [EDP Sciences] [Google Scholar]
- Panessa, F., Bassani, L., Cappi, M et al. 2006, A&A, 455, 173 [NASA ADS] [CrossRef] [EDP Sciences] [Google Scholar]
- Poole, T., Breeveld, A. A., Page, M. J., et al. 2008, MNRAS, 383, 627 [NASA ADS] [CrossRef] [Google Scholar]
- Protassov, R., van Dyk, D., & Connors, A. 2002, ApJ, 571, 545 [NASA ADS] [CrossRef] [Google Scholar]
- Read, A., Saxton, R., Torres, M., et al. 2008, A&A, 482, L1 [NASA ADS] [CrossRef] [EDP Sciences] [Google Scholar]
- Rees, 1988, Nature, 333, 523 [NASA ADS] [CrossRef] [Google Scholar]
- Reeves, J., Done, C., Pounds, K., et al. 2008, MNRAS, 385, 108 [Google Scholar]
- Risaliti, G., Elvis, M., Fabbiano, G., Baldi, A., & Zezas, A. 2005, ApJ, 623, L93 [NASA ADS] [CrossRef] [Google Scholar]
- Roming, P., Kennedy, T. E., Mason, K. O., et al. 2005, Space Sci. Rev., 120, 95 [NASA ADS] [CrossRef] [Google Scholar]
- Ross, R., & Fabian, A. 2005, MNRAS, 358, 211 [Google Scholar]
- Sault, R., Teuben, P., & Wright, M. 1995, ASPC, 77, 433 [Google Scholar]
- Saunders, W., Bridges, T., Gillingham, P., et al. 2004, SPIE, 5492, 389 [NASA ADS] [Google Scholar]
- Saxton, R., Read, A., Esquej, P., et al. 2008, A&A 480, 611 [NASA ADS] [CrossRef] [EDP Sciences] [Google Scholar]
- Saxton, R., Read, A., Esquej, P., et al. 2012, A&A, 541, A106 [NASA ADS] [CrossRef] [EDP Sciences] [Google Scholar]
- Schartel, N., Rodríguez-Pascual, P., Santos-Lleo, M., et al. 2010, A&A, 512, A75 [NASA ADS] [CrossRef] [EDP Sciences] [Google Scholar]
- Scott, A., & Stewart, G. 2014, MNRAS, 438, 2253 [NASA ADS] [CrossRef] [Google Scholar]
- Seyfert, C. 1943, ApJ, 97, 28 [NASA ADS] [CrossRef] [Google Scholar]
- Shappee, B., Prieto, J., & Grupe, D. 2014, ApJ, 788, 48 [NASA ADS] [CrossRef] [Google Scholar]
- Sharp, R., & Birchall, M. 2010, PASA, 27, 91 [NASA ADS] [CrossRef] [Google Scholar]
- Sharp, R., Saunders, W., Smith, G., Churilov, V., & Correll, D. 2006, SPIE, 6296, 14 [Google Scholar]
- Skrutskie, M., Cutri, R., Stiening, R., et al. 2006, AJ, 131, 1163 [NASA ADS] [CrossRef] [Google Scholar]
- Steffen, A., Strateva, I., Brandt, W., et al. 2006, AJ, 131, 2826 [NASA ADS] [CrossRef] [Google Scholar]
- Trümper, J. 1983, Adv. in Space Res. 2, 4, 241 [Google Scholar]
- van Velzen, S., Fasrrar, G., Gezari, S., et al. 2011, ApJ, 741, 73 [NASA ADS] [CrossRef] [Google Scholar]
- Vasudevan, R., & Fabian, A. 2007, MNRAS, 381, 1235 [NASA ADS] [CrossRef] [Google Scholar]
- Vasudevan, R., Mushotzky, R., Winter, L., & Fabian, A. 2009, MNRAS, 399, 1553 [NASA ADS] [CrossRef] [Google Scholar]
- Veilleux, S., & Osterbrock, D. E. 1987, ApJS, 63, 295 [NASA ADS] [CrossRef] [Google Scholar]
- Voges, W., Aschenbach, B., Boller, T., et al. 1999, A&A, 349, 389 [NASA ADS] [Google Scholar]
- Wilson, W., Ferris, R., Axtens, P., et al. 2011, MNRAS, 416, 832 [NASA ADS] [CrossRef] [Google Scholar]
- Zauderer, B., Berger, E., Soderberg, A. M., et al. 2011, Nature, 476, 425 [NASA ADS] [CrossRef] [PubMed] [Google Scholar]
All Tables
Optical line widths and intensities for XMMSL1 J0619-65 from the AAOmega 2dF observation of 2012-12-03.
All Figures
|
Fig. 1 Digitised sky survey r-filter image of the galaxy 2MASX 06192755-6553079, shown with the XMM-Newton slew error circle (8″ radius) and UVOT-enhanced Swift error circle (1.9″ radius; see text) centred on the detections. |
| In the text | |
|
Fig. 2 AAOmega 2dF spectrum of XMMSL1 J0619-65 taken on 2012-12-03, after removal of narrow skyline features. |
| In the text | |
|
Fig. 3 Comparison of the Hα profile of the two AAOmega 2dF spectra of XMMSL1 J0619-65 taken on 2012-12-03 (blue) and 2013-10-18 (green). Both spectra have been normalised to their respective continua. The dotted lines represent fits of a multi-component (very broad, broad and narrow lines) model (see text). The lower panel shows the difference spectrum produced when subtracting the normalised 2012-12-03 profile from that of 2013-10-18. |
| In the text | |
|
Fig. 4 0.2–2 keV X-ray light curve of XMMSL1 J0619-65. Upper: the full historical light-curve, lower: a zoom into the more recent data. The symbols are: XSS (red diamonds or arrows for upper limits), XMM-Newton pointed observations (red triangles), Swift-XRT (black squares), ROSAT upper limit (blue arrow). The blue dotted vertical lines indicate the dates of the optical observations. |
| In the text | |
|
Fig. 5 Background subtracted, exposure corrected, EPIC-pn, 0.2−10 keV, light curves and area-normalised background, for the 2012-12-15 (top) and 2013-04-24 (bottom) XMM-Newton pointed observations. |
| In the text | |
|
Fig. 6 UV light curve of XMMSL1 J0619-65 taken from the Swift-UVOT and XMM-Newton-OM observations using the filters: U (3480 Å), UVW1 (2950 Å), UVW2 (2120 Å) and UVM2 (2340 Å). |
| In the text | |
|
Fig. 7 Comparison of EPIC-pn spectra from the XMM-Newton pointed observations of 2012-12-15 (black) and 2013-04-20 (red). The lower panel presents residuals to independent fits of a power-law model, absorbed by the Galactic column, to the 2−10 keV data of each spectrum. |
| In the text | |
|
Fig. 8 Ratio of the 2−10 keV to 0.2−2.0 keV flux, calculated by fitting a phenomenological model of a power-law plus a black-body of kT = 120 eV absorbed by the Galactic column, as a function of the (absorbed) X-ray (0.2–10 keV) flux (upper) and observation date (lower). |
| In the text | |
|
Fig. 9 Galactic-absorption corrected spectral energy distribution of XMMSL1 J0619-65. Data are, from low to high energy, ATCA (green), WISE (orange), 2MASS (red), XMM-Newton-OM (blue), Galex (pink) and XMM-Newton EPIC-pn (black). The Galex points were taken in 2007, likely during a slightly lower luminosity state than the XMM-Newton measurements of 2012-12-15. The lower panel shows a zoom into the IR-X-ray data. |
| In the text | |
Current usage metrics show cumulative count of Article Views (full-text article views including HTML views, PDF and ePub downloads, according to the available data) and Abstracts Views on Vision4Press platform.
Data correspond to usage on the plateform after 2015. The current usage metrics is available 48-96 hours after online publication and is updated daily on week days.
Initial download of the metrics may take a while.