Fig. 4
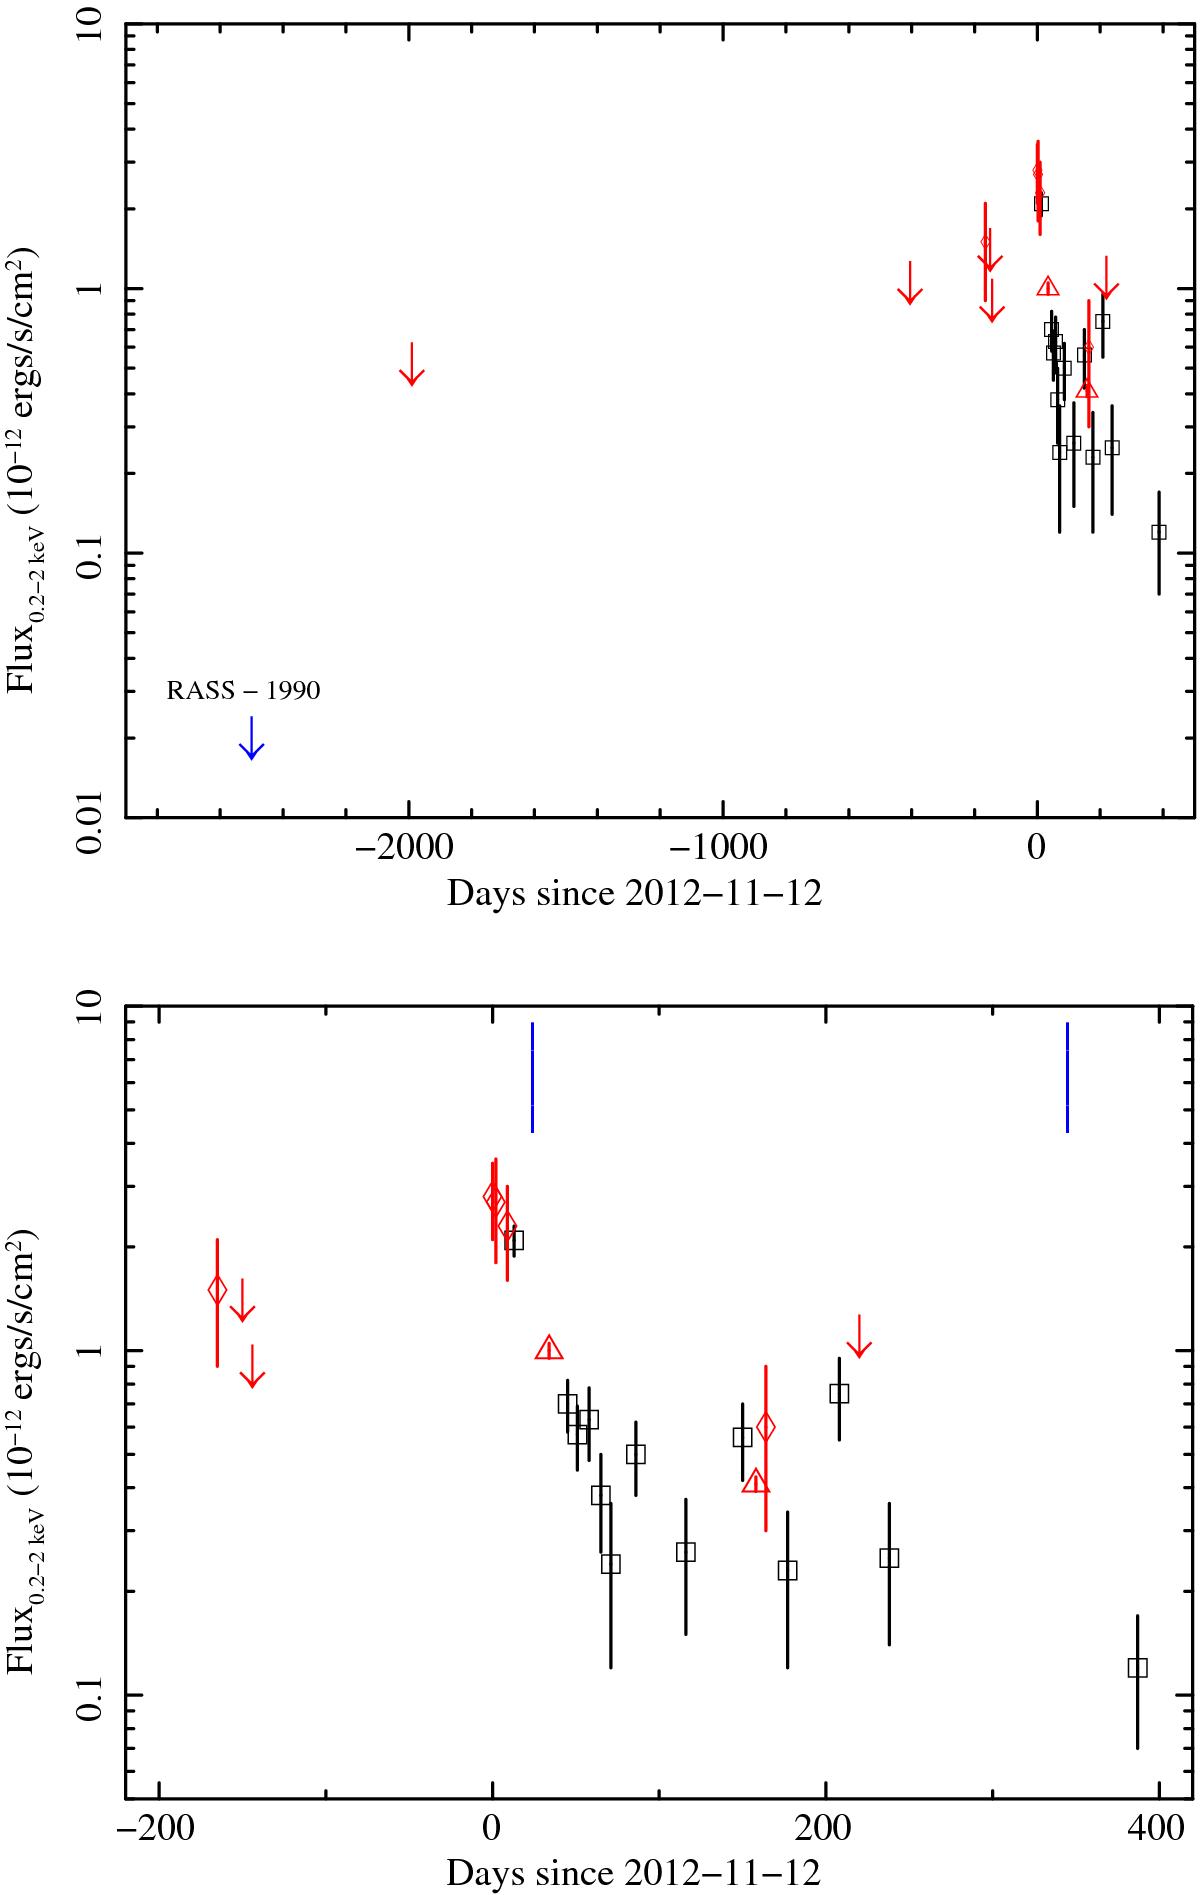
0.2–2 keV X-ray light curve of XMMSL1 J0619-65. Upper: the full historical light-curve, lower: a zoom into the more recent data. The symbols are: XSS (red diamonds or arrows for upper limits), XMM-Newton pointed observations (red triangles), Swift-XRT (black squares), ROSAT upper limit (blue arrow). The blue dotted vertical lines indicate the dates of the optical observations.
Current usage metrics show cumulative count of Article Views (full-text article views including HTML views, PDF and ePub downloads, according to the available data) and Abstracts Views on Vision4Press platform.
Data correspond to usage on the plateform after 2015. The current usage metrics is available 48-96 hours after online publication and is updated daily on week days.
Initial download of the metrics may take a while.