Fig. 3
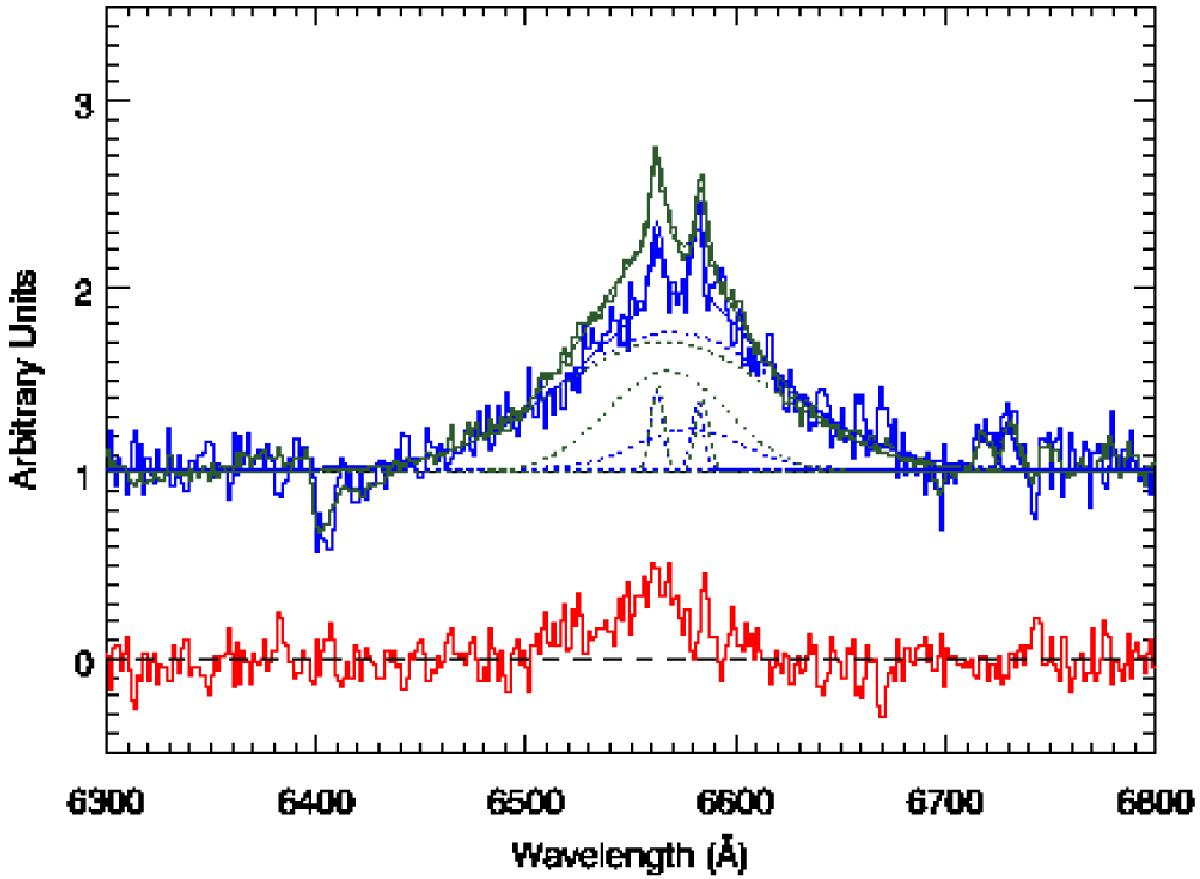
Comparison of the Hα profile of the two AAOmega 2dF spectra of XMMSL1 J0619-65 taken on 2012-12-03 (blue) and 2013-10-18 (green). Both spectra have been normalised to their respective continua. The dotted lines represent fits of a multi-component (very broad, broad and narrow lines) model (see text). The lower panel shows the difference spectrum produced when subtracting the normalised 2012-12-03 profile from that of 2013-10-18.
Current usage metrics show cumulative count of Article Views (full-text article views including HTML views, PDF and ePub downloads, according to the available data) and Abstracts Views on Vision4Press platform.
Data correspond to usage on the plateform after 2015. The current usage metrics is available 48-96 hours after online publication and is updated daily on week days.
Initial download of the metrics may take a while.