Fig. 6
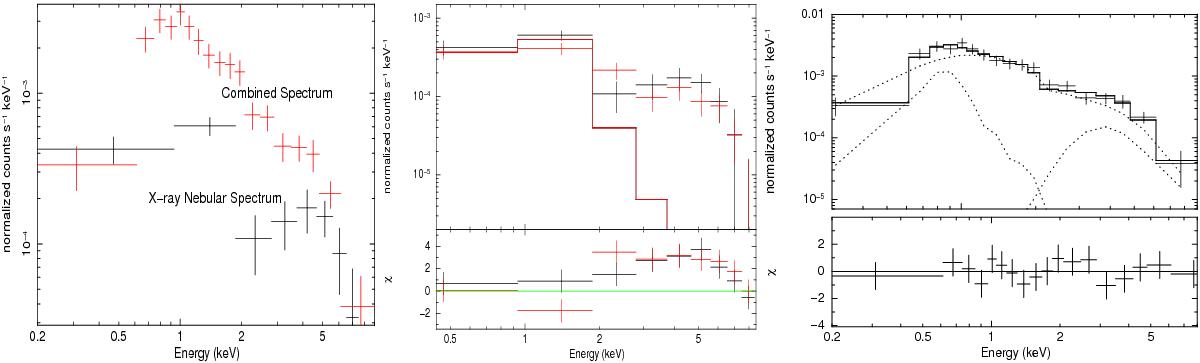
Left panel: combined/total spectrum of the source plus the nebular emission in the X-rays (in red) and the nebular X-ray spectrum of T Pyx (in black). Middle panel: fit of a single componant plasma model to the X-ray nebular spectrum and the residuals in sigmas. Black denotes the spectrum derived from the 2×2 pixel smoothed images (also on the left) and the red spectrum is the one derived from the 3×3 pixel smoothed images. Right panel: Chandra ACIS-S3 combined spectrum fitted with (tbabs*(MEKAL+CEVMKL)+tbabs*MEKAL) model of emission. The dotted lines show the contribution of the three fitted models, two of which fit the X-ray nebular spectrum and the third fits the central source spectrum. The lower panel shows the residuals in standard deviations (in sigma).
Current usage metrics show cumulative count of Article Views (full-text article views including HTML views, PDF and ePub downloads, according to the available data) and Abstracts Views on Vision4Press platform.
Data correspond to usage on the plateform after 2015. The current usage metrics is available 48-96 hours after online publication and is updated daily on week days.
Initial download of the metrics may take a while.