Fig. 3
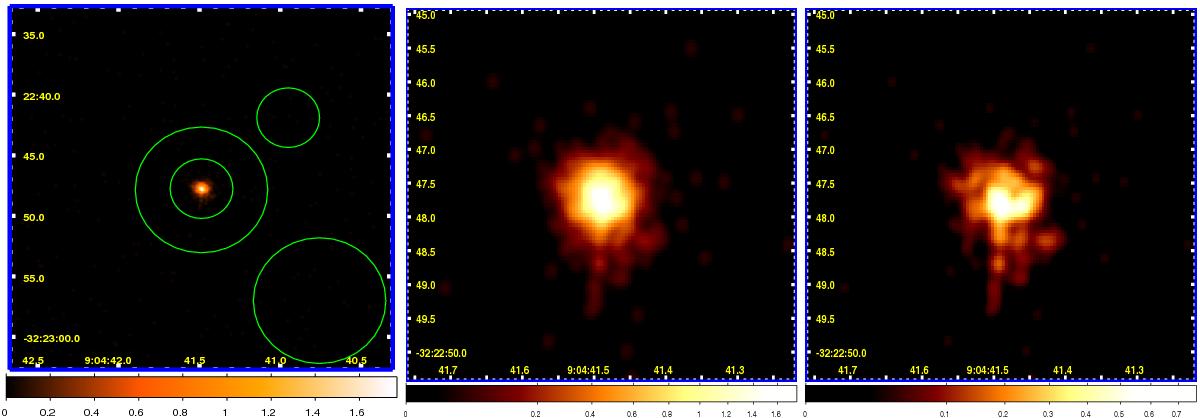
X-ray images of T Pyx Nebula in the 0.2 to 7.0 keV range. North is up and west is to the right. Left panel: vicinity of the source within 15 arcsec radius and the photon extraction radii for the source and background are overlaid for 5 and 2.5 arcsec. Middle panel: image without the subtraction of the central source PSF. Right panel: PSF-subtracted image. The resolution is 0.̋25 per pixel in the right panel. The axes on the figures show RA (x-axis) and Dec (y-axis). The images utilize different brightness levels using the square root scaling.
Current usage metrics show cumulative count of Article Views (full-text article views including HTML views, PDF and ePub downloads, according to the available data) and Abstracts Views on Vision4Press platform.
Data correspond to usage on the plateform after 2015. The current usage metrics is available 48-96 hours after online publication and is updated daily on week days.
Initial download of the metrics may take a while.