Fig. A.1
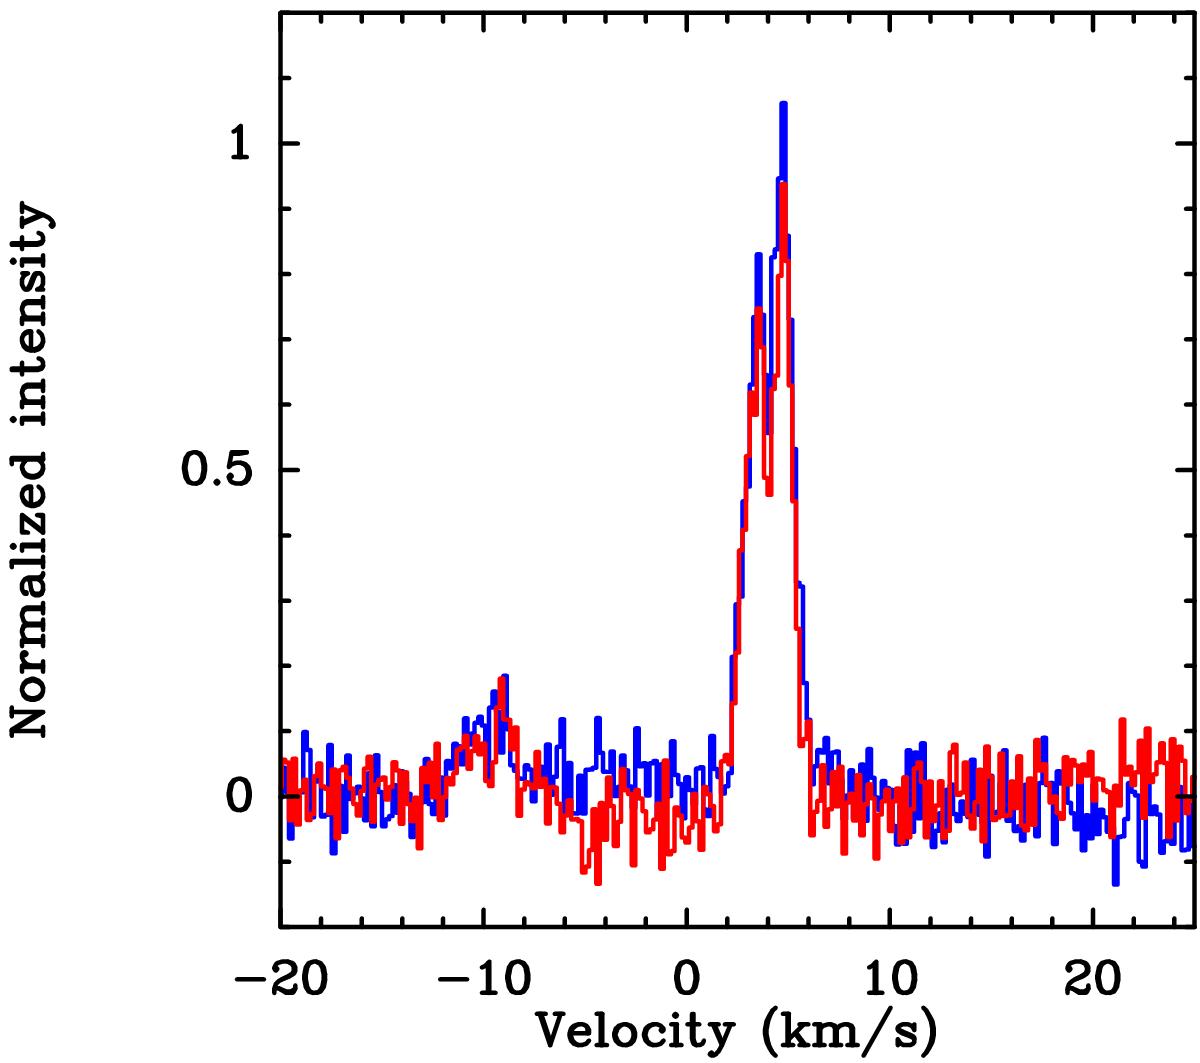
Comparison of the H13CO+(3−2) line from IRAS 16293A observed with APEX. The spectra resulting from phase 1 (corresponding to off position on one side of the source in symmetric wobbler switching mode) and phase 2 (off position on the other side) are shown in blue and red, respectively. The spectra have been baseline subtracted and normalized to the average peak intensity of the two spectra. Data from 2012-04-01.
Current usage metrics show cumulative count of Article Views (full-text article views including HTML views, PDF and ePub downloads, according to the available data) and Abstracts Views on Vision4Press platform.
Data correspond to usage on the plateform after 2015. The current usage metrics is available 48-96 hours after online publication and is updated daily on week days.
Initial download of the metrics may take a while.