Fig. 4
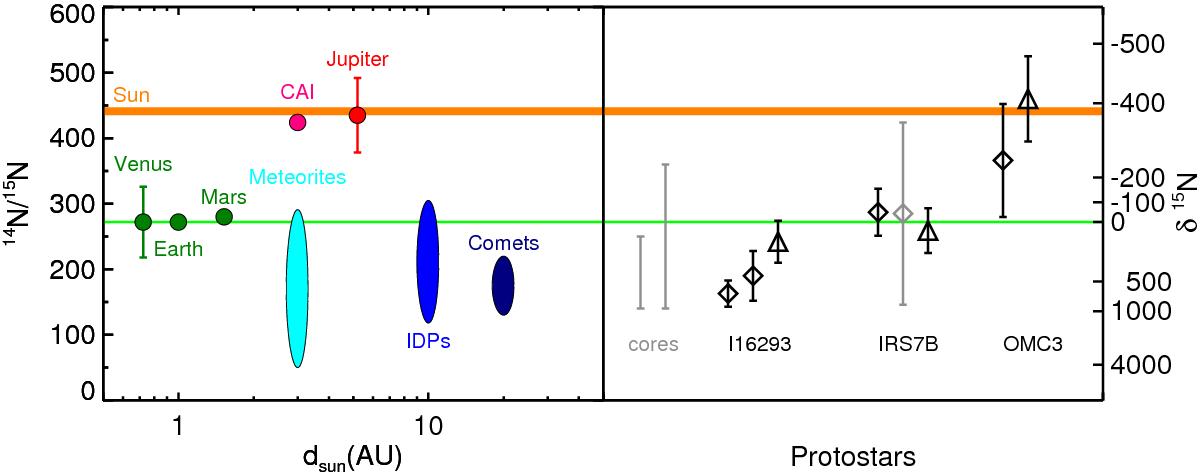
Left panel: illustration of the nitrogen isotope heterogeneity of the solar system, adapted from Meibom et al. (2007); Mumma & Charnley (2011). Comets, meteorites, and interstellar dust particles (IDPs) are located over a range of distances from the Sun and the plotted dSun values should be regarded as an average value only. Right panel: 14N/15N ratios obtained from APEX measurements (black, this work) and ASTE (gray, Watanabe et al. 2012). Diamonds and triangles indicate values from HCN and HNC isotopologues, respectively. Error bars are 1σ for combined uncertainties on the calibration and the intensity. The gray bars (“cores”) indicate the prestellar core values from HCN by Hily-Blant et al. (2013a).
Current usage metrics show cumulative count of Article Views (full-text article views including HTML views, PDF and ePub downloads, according to the available data) and Abstracts Views on Vision4Press platform.
Data correspond to usage on the plateform after 2015. The current usage metrics is available 48-96 hours after online publication and is updated daily on week days.
Initial download of the metrics may take a while.