Fig. 2
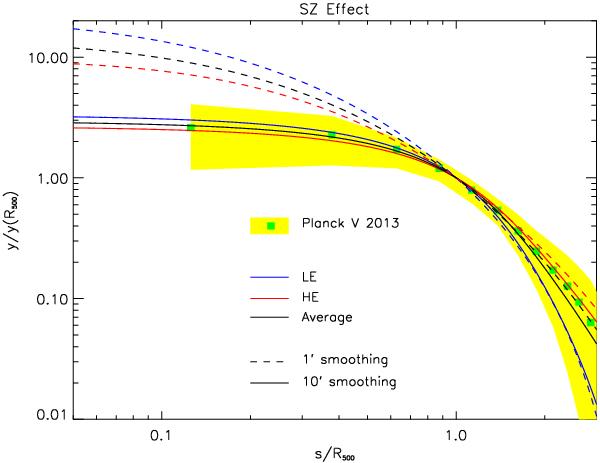
Our predicted SZ patterns, corresponding to the pressure profiles marked with the same colors as in Fig. 1. The dashed lines refer to a resolution around 1′ (closely matching the unconvolved patterns), and the solid lines to a resolution around 10′ like Planck’s. The data are from SZ observations after Planck Collaboration V (2013; green squares, with yellow shaded area showing the associated variance).
Current usage metrics show cumulative count of Article Views (full-text article views including HTML views, PDF and ePub downloads, according to the available data) and Abstracts Views on Vision4Press platform.
Data correspond to usage on the plateform after 2015. The current usage metrics is available 48-96 hours after online publication and is updated daily on week days.
Initial download of the metrics may take a while.