| Issue |
A&A
Volume 571, November 2014
|
|
|---|---|---|
| Article Number | A91 | |
| Number of page(s) | 5 | |
| Section | Galactic structure, stellar clusters and populations | |
| DOI | https://doi.org/10.1051/0004-6361/201424056 | |
| Published online | 14 November 2014 | |
Milky Way demographics with the VVV survey⋆
III. Evidence for a great dark lane in the 157 million star bulge color–magnitude diagram
1
Departamento de Ciencias FísicasUniversidad Andrés Bello,
República 220, 837-0134
Santiago
Chile
e-mail:
This email address is being protected from spambots. You need JavaScript enabled to view it.
2
Instituto de Astrofísica, Pontificia Universidad Católica de
Chile, Av. Vicuña Mackenna 4860,
Casilla 306, Santiago
22, Chile
3
Millennium Institute of Astrophysics, Av. Vicuña Mackenna 4860, 782-0436
Macul Santiago,
Chile
4
Vatican Observatory, 00120
Vatican City State,
Italy
5
Universidade Federal de Sergipe, Departamento de
Física, Av. Marechal Rondon s/n,
49100-000
São Cristóvão, SE, Brazil
6
European Southern Observatory, 19001
Casilla Santiago 19,
Chile
7
European Southern Observatory, Karl-Schwarzschild-Strasse 2, 85748
Garching,
Germany
8
Department of Physics, University of Wisconsin,
Whitewater, WI
53190,
USA
9
Astronomy Unit, School of Physics and Astronomy, Queen Mary
University of London, Mile End
Road, London,
E1 4NS,
UK
10
Centre for Astrophysics Research, University of
Hertfordshire, College
Lane, Hatfield
AL10 9AB,
UK
11
Université de Nice-Sophia-Antipolis, CNRS, Observatoire de Côte
d’Azur, Laboratoire Lagrange, 06304
Nice Cedex 4,
France
Received: 24 April 2014
Accepted: 17 September 2014
Abstract
The new generation of IR surveys are revealing and quantifying Galactic features that provide an improved 3D interpretation of our own Galaxy. We present an analysis of the global distribution of dust clouds in the bulge using the near-IR photometry of 157 million stars from the VVV survey. We investigate the color−magnitude diagram of the Milky Way bulge, which shows a red giant clump of core He burning stars that is split into two color components, with a mean color difference of (Z − Ks) = 0.55 mag that is equivalent to AV = 2.0 mag. We conclude that there is an optically thick dust lane at intermediate latitudes above and below the plane that stretches across several square degrees from l = −10° to l = +10°. We call this feature the great dark lane. Although its exact distance is uncertain, it is located in front of the bulge. The evidence for a large-scale great dark lane within the Galactic bulge is important for constraining models of the barred Milky Way bulge and for comparing our galaxy with external barred galaxies in which these types of features are prominent. We discuss two other potential implications of the great dark lane for microlensing and bulge stellar populations studies.
Key words: Galaxy: center / Galaxy: structure / stars: late-type / dust, extinction / surveys
Based on observations taken within the ESO VISTA Public Survey VVV, Programme ID 179.B-2002.
© ESO, 2014
1. Introduction
All-sky IR surveys, such as COBE and 2MASS, represent a revolution for research into Galactic structure. These surveys have provided the necessary tools for investigating the large-scale structure of the Milky Way galaxy. On the other hand, the new generation of IR surveys such as GLIMPSE (Benjamin et al. 2005), UKIDSS-GPS (Lucas et al. 2008), and VVV (Minniti et al. 2010) are now providing a much more detailed view of our Galaxy by identifying and quantifying structures that before were ambiguous or unclear. Particularly important is the capability of recent surveys to trace red clump (RC) stars across the Galaxy, even in the most reddened regions. RC stars are helium-burning giants, counterpart of the metal-poor horizontal branch stars seen in globular clusters; they have been proven to be reliable distance indicators. Therefore, by investigating the distribution of RC stars, we are able to map the morphology of the Galaxy (e.g., Stanek et al. 1994; Rattenbury et al. 2007).
The RC stars can be easily identified in the bulge color−magnitude diagram (CMD), and their mean observed magnitude can be determined by constructing the bulge luminosity function. It has recently been found that the RC is double in magnitude in the bulge (McWilliam & Zoccali 2010; Nataf et al. 2010). The two RCs can only be seen simultaneously along the bulge minor axis fields, and their magnitude difference increases with increasing Galactic latitude. A detailed mapping of the distribution of RC stars in the Bulge using 2MASS data allowed Saito et al. (2011) to confirm the interpretation from McWilliam & Zoccali (2010) that the double RC traces the X-shaped morphology of the bulge. Additionally, the stellar kinematics in the bright and faint red clump (Vásquez et al. 2013), and the deeper RC stars mapping based on VVV survey data (Wegg & Gerhard 2013), confirmed this interpretation.
Here we report a different feature of the RC stars in the bulge: the observation of a split in the distribution of RC stars into two different colors; the two distributions have very similar Ks-band magnitudes. The small difference in magnitude is consistent with the color difference being due to extinction by dust. We interpret this to be caused by a dust lane that runs across the whole Milky Way bulge at intermediate latitudes; we call this feature the “great dark lane” of the Milky Way bulge.
This article is organized as follows: in Sect. 2 we present the CMD for 157 million stars in 300 sq. deg of the bulge, discussing the RC split into two color components, blue and red, and the spatial distribution of the great dark lane. Section 3 presents a more detailed exploration of one field at (l,b) = −0.6°, −1.9° which shows a mean color difference of ΔAKs = 1.79 for red and blue RC components. This deep pencil-beam study allows us also to explain why this feature has not been seen previously in optical CMDs. Section 4 presents our interpretation of the small difference in magnitude of the RC seen in our CMDs as a geometric effect. Finally, Sect. 5 discusses some of the implications for studies of galactic structure, bulge stellar populations, and microlensing experiments.
2. Color-split in the red giant clump of the Galactic bulge
By updating the work of Saito et al. (2012), we have merged all ZYJHKs VVV bulge catalogs that appear in the CASU1 database as v1.3 “completed” data, covering 300 sq. deg, from − 10°<l< 10°, −10°<b< 5°. These data come from 196 bulge tiles that contain 239 million sources (with detection in any filter), 157 million of these are stellar sources, with stellar flag in at least two of the five filters (stellar flag denotes good-quality unblendend sources). For the ten tiles for which “completed” data were not available, we used “executed”, “aborted” and data without a flag.
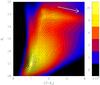 |
Fig. 1 Ks vs. (Z − Ks) color–magnitude diagram of 66 million stars from 300 sqdeg in the bulge. This Hess CMD is very useful because it reveals in an unprecedented way very faint features, the complexity of the population, the effects of reddening, and the range of magnitudes and colors throughout the whole Milky Way bulge. Particularly interesting is the double peak of the red giant clump at Ks ~ 13.2 mag, separated by Δ(Z − Ks) = 0.55 mag. This is an evidence of the great dark lane across the Milky Way bulge. Completeness in the inner regions only becomes a problem for Ks> 16 mag. The reddening vector is associated with an extinction of E(B − V) = 1, based on the relative extinctions of the VISTA filters, and assuming the extinction law of Cardelli et al. (1989). Contour lines mark density levels in steps of 2% from the highest density. The source density is indicated in the vertical bar on the right, in units of 106 sources mag-2. |
 |
Fig. 2 Left panel: spatial distribution of stars in the blue RC with 12.8 <Ks< 13.5 and 1.5 < (Z − Ks) < 2.0. Right panel: spatial distribution of stars in the red RC with 12.8 <Ks< 13.5 and (Z − Ks) > 2.1. These stars trace the location of the bulge dark lane. The innermost dark region with −1 <b< + 1 is populated by much more reddened RC giants and thus is affected by completeness. The source density is indicated in the vertical bar on the right, in units of 103 sources deg-2. |
The resulting Ks vs. (Z − Ks) CMD is shown in Fig. 1. Only good-quality (flag −1) stellar sources in both Z and Ks-band filters were included in the construction of the CMD, which contains a total of about 70 million sources. These unprecedented VVV data allow us to analyze the large-scale spatial variations of this CMD and the effects of reddening (e.g., Saito et al. 2012).
The effect of the interstellar extinction on the CMD is evident: it spreads the RC stars along the reddening vector by more than 3 mag in (Z − Ks). Although this effect is expected, Fig. 1 shows that this re-distribution of RC stars in color is not continuous but, instead, presents two clear overdensities that split the RC into a blue and a red component (we use this convention to avoid confusion).
The mean observed (Z − Ks) color difference between these two RCs is 0.55 ± 0.03 magnitudes. If this color difference is purely due to reddening, this is equivalent to E(B − V) = 0.65 and AV = 2.01 mag, using the ratios E(Z − Ks) = 1.18 × E(B − V) and E(J − Ks) = 0.50 × E(B − V) (Catelan et al. 2011), corresponding to a very dark feature indeed. A similar double-color RC is observed in the Ks vs. (J − Ks) CMD (e.g., Saito et al. 2012), but the separation between the blue and red RC is best appreciated with the longer color baseline provided by the (Z − Ks) color.
To evaluate this and to map the different spatial distribution of these sources, we adopted the following boundaries for the two components of the red clump (RC): a blue RC with 12.8 <Ks< 13.5 and 1.5 < (Z − Ks) < 2.0, and a red RC with 12.8 <Ks< 13.5 and (Z − Ks) > 2.1. The spatial distribution of blue and red components of the RC are shown separately in Fig. 2. The spatial distribution of the red component is almost symmetric about the galactic plane unlike the bluer RC. Figure 2 shows that the great dark lane stretches across the whole bulge, above and below the plane. The distribution of stars affected by the dark lane is homogeneous and not patchy, with a sharp transition at latitudes | b | < 4°. It extends for many square degrees in Galactic longitude, from l = −10° to l = + 10°. Unfortunately, although the VVV maps extend in longitude from l = 350° to l = 295°, they only cover a narrow strip along the plane for latitudes −2.25°<b< + 2.25°, which prevents us from investigating its extension in longitude.
Assuming a smooth stellar density distribution for the bulge (Wegg & Gerhard 2013), the marked split in the color distribution of the RC suggests that there must be a region in the bulge where stars are affected by a dust feature that is optically much thicker than the dust affecting the stars in the blue RC component. We would otherwise expect a smooth color transition between RC stars for regions that are differently affected by extinction. Furthermore, if this dust feature was located in the middle of the bulge population, we would see RC stars from the blue and red components mixed across the bulge. In contrast, we see that the two components are spatially distributed in specific regions of the bulge. These properties lead us to conclude that there is an optically thick dust feature with sharp, clearly marked edges that is located in front of the bulge. We name this dust feature the great dark lane of the Milky Way bulge. We note that according to the Galactic latitudes up to which the dark lane extends (| b | < 4°), the projected distance from the plane would be ~400 pc, at a mean distance of 6 kpc (i.e., at the near side of the bulge).
3. Point spread function fitting photometry of a field at (l, b = –0.6°, –1.9°)
The photometry by CASU is aperture photometry, therefore it may be limited by crowding in the inner regions, even though the effect is expected to be minor for stars at the RC level and more significant for fainter stars. To confirm that this great dark lane feature is real and to quantify the effect produced, we decided to obtain deeper point spread function fitting (PSF) photometry in a representative inner field – VVV tile b305 – located at (l,b) = −0.6°, −1.9°. The right and middle panels of Fig. 3 show the deep Ks vs. (J − Ks) and Y vs. (Z − Y) CMDs for one chip of this tile obtained with PSF photometry using DoPhot (Schechter et al. 1993; Alonso-García et al. 2012). This field was selected because it can be interpreted unambiguously: it crosses the edge of the dust lane that contains stars of both blue and red RC components.
Again, the Ks vs. (J − Ks) RGB in this field is split into two well-defined branches, and two red giant clumps can be identified. The separation can be easily measured when the red giant clump is split into color by Δ(J − Ks) = 0.30 ± 0.03 mag. If this color jump is interpreted as only due to the effect of extinction from an intervening cloud along the line of sight, this is equivalent to Δ(B − V) = 0.57 ± 0.06, and Δ(AV) = 1.78. These values are similar to the values obtained using the whole Ks vs. (Z − Ks) CMD in Sect. 2.
In contrast, the disk main sequence in this field is well defined in the Ks vs. (J − Ks) CMD, somewhat broad because of foreground differential reddening, but clearly not bimodal like the RGB. This indicates that these disk stars lie predominantly in the foreground of the great dust lane.
The mean reddening for the region located at −0.68 <l< −0.52, −1.98 <b< −1.82 was measured by Gonzalez et al. (2011) to be E(B − V) = 1.46 using the reddening law of Cardelli et al. (1989). There is evidence that the reddening law varies in the inner regions (e.g., Nishiyama et al. 2009), but choosing a different reddening law does not affect our results. Taking this value as mean reddening, the extinction varies from an average of E(B − V) = 1.18 for the bulge stars that are unaffected by the great dark lane to an average of E(B − V) = 1.75 for the stars located behind it. This total extinction only applies to this particular field b305. Even though we see the coherent split of the RGB across the whole bulge, this may vary in distance, and a finer 3D mapping for the extinction is warranted (e.g., with individual RR Lyrae discovered by the VVV survey).
Many of the inner fields have been mapped by the microlensing experiments in optical passbands (Alcock et al. 2000; Udalski et al. 2002). However, such a split clump has never been reported, which seems to contradict our findings. The reason for this becomes evident in the bluer Y vs. (Z − Y) CMD, which is closer to optical (MACHO, OGLE) CMDs of the same stars in the left panel of Fig. 3. The RGB in the Y vs. (Z − Y) CMD is very broad, and the red giant clump extends along the direction of the reddening vector, but at these wavelengths the differential extinction blurs the split color of the RGB, which instead appears as a single wide branch, with a color spread of about 0.5 mag. This color scatter is real and not an effect of larger photometric errors in the ZY passbands, because the photometry in all these bands is better than 0.02 mag at the level of the red giant clump.
In the central panel of Fig. 3 we selected the stars with Ks magnitudes that include the RC as 13.0 <Ks< 13.6, and plot the color−color diagram for this bulge field in the right panel of Fig. 3. The stars are aligned following the reddening vector. The red clump bimodality is in (J − Ks), but not in (Z − Y), and at the same time the foreground main sequence is unimodal. This explains why this was not noticed in the previous optical CMDs that mapped the inner bulge region, such as the photometry of the microlensing experiments. Figure 3 shows the advantage of having ZYJHKs passbands in the VVV survey: there are features in the CMDs that can be ambiguous or missing when we only inspect single CMDs.
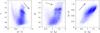 |
Fig. 3 Data from PSF photometry. Left: Y vs. (Z − Y) CMD of one chip of the tile b305 centered at (l,b) = −0.6, −1.9 showing no double clump at more optical wavelengths due to extinction. Middle: Ks vs. (J − Ks) CMD for the same stars showing the double clump due to extinction. This is the observed CMD, it is not dereddened. Right: (Z − Y) vs. (J − Ks) color−color diagram for stars with clump giant magnitudes 13.0 <Ks< 13.6. The reddening vector in each panel is associated with an extinction of E(B − V) = 1, based on the relative extinctions of the VISTA filters, and assuming the extinction law of Cardelli et al. (1989). |
4. Geometric effect and metallicity
An interesting aspect of Fig. 1 is the similar Ks-band magnitude of the the blue and red RCs, with a distribution flatter than that expected by the corresponding reddening vector.
The mapping of the RC stars across the Milky Way bulge has been used by several authors to trace the geometry of the bar and its splitting into an X-shaped structure (e.g., Gerhard & Martinez-Valpuesta 2012; Saito et al. 2011, 2012). These results demonstrate that the RC magnitude varies with longitude across the bulge in the sense that at positive longitudes the RC is brighter than at negative longitudes. Moreover, the RC magnitude also varies with Galactic latitude, since the projected distance of the Galactic bar changes when measured at higher values of b (e.g., Saito et al. 2011; Gerhard & Martinez-Valpuesta 2012).
At a given value of Galactic longitude, the red RC, which is affected by the dust lane, is constrained to regions at low | b |. On the other hand, the blue RC, which is unaffected by the dust lane, comes from regions at higher | b | (farther from the plane). Thus, the magnitude of the clumps varies with the projected distance of the bar – at high | b | (responsible for the blue RC) the bar is projected farther away than in the Galactic plane (the red RC, at low | b |). This effect is stronger at negative longitudes and prevents the blue and red RC following the reddening vector.
We clarified this effect by slicing two bulge regions, one at positive longitudes + 2°<l< + 6° and another symmetric region at negative longitudes (−6°<l< −2°). Figure 4 shows the Ks vs. (Z − Ks) CMDs for the region around the RC position for both regions. While the difference in color between the blue and red RC for both regions is consistent with the presence of a thick dust lane, the position in magnitude changes in all cases because of the projection effect.
If the bimodal RGB and RC are not a result of extinction, we have to search for alternative explanations. One possibility is that there are two stellar populations with different metallicities. The large majority of the stars in the bulge have metallicities of −0.7 < [Fe/H] < + 0.2 (e.g., Zoccali et al. 2008; Gonzalez et al. 2013). Based on the isochrones of Girardi et al. (2000), the mean absolute magnitude of red clump stars varies from MK = −1.306 mag ([Fe/H] = −0.68 and Z = 0.004) to MK = −1.571 mag ([Fe/H] = + 0.2 and Z = 0.03).
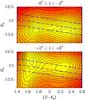 |
Fig. 4 Ks vs. (Z − Ks) color–magnitude diagrams for the region around the red clump position. In the top panel we show data for −6°<l< −2°, in the bottom panel data for the region + 2°<l< + 6°. The dashed lines mark the slope of reddening vectors based on the relative extinctions of the VISTA filters, and assuming the extinction law of Cardelli et al. (1989). Contour lines mark density levels in steps of 5% from the highest density. |
In principle, since all these stars are present in all fields, the difference in metallicity produces a spread in Ks-magnitude of the RC (width) of about ΔKs ~ 0.27 mag. However, to produce a shift in the mean magnitude of ~0.27 mag in ΔKs one would need a shift of about ~1 dex in the mean magnitude of the RC stars in the redder and in the bluer clump.
Gonzalez et al. (2013) have recently produced a full metallicity map for the Galactic bulge. The l< 0° region is more metal poor, and for this region the average magnitude of the clump would be fainter than for l> 0°. However, the red RC, which is the component affected by the dust lane, is constrained to | b | < 3°. Both the l> 0° and l< 0° parts of the bulge have a similar metallicity for | b | < 3°. The RC magnitude of the red RC therefore probably purely depends on distance and extinction. Given a similar extinction in the positive and negative l, the only difference in ΔKs of the red RC for + l and −l is then due to distance/projection.
In the absence of extinction, purely due to sampling different | b | (assuming that the only difference is metallicity), the blue RC should be fainter than the red component. The difference in metallicity between the positive and negative latitude of the bulge between | b | < 3° and | b | > 3° for l> 0° is Δ[Fe/H] ~ 0.2 and is larger Δ[Fe/H] ~ 0.4−0.5 for l< 0. This might contribute to the different slope between the the blue and red RC.
The value of the shift in ΔKs on the blue RC (comparing to red RC) due to a metallicity effect alone would be ~0.08 mag for l> 0° and ~0.13 mag for l< 0°. Therefore, there is a mixture of both the projection/distance and metallicity in the full map, but the metallicity effect is weaker. The largest difference in the mean metallicity produces a shift in ΔKs of about 0.1 mag.
A similar analysis can be applied to the Z-band, and the results demonstrate that the largest Δ(Z − Ks) color difference due to metallicity is smaller than ~0.2 mag. Thus the difference in metallicity is not enough to account for the split of the two RCs. Additional double populations consisting of two different ages can be discarded using similar arguments, and also because we do not see the corresponding main sequence of a younger population. The extinction caused by an optically thick dust lane seems to be the only remaining explanation for the observed split RC in color.
5. Discussion and implications
The near-IR CMDs of 157 million sources across 300 sq. deg in the Galactic bulge shows that the red clump giants are split in color. Selecting the sources belonging to the blue and red RCs we studied the global distribution of dust in the Milky Way bulge, finding evidence for a large homogeneous dust absorption across the bulge that we call the great dark lane.
Even though its distance is unknown, we suggest that this dust lane is probably located in front of the bulge. This is supported by the 3D dust extinction maps by Schultheis et al. (2014), who found a large jump in extinction at low latitude located at a distance of about 6 kpc along the line of sight to the bulge. This may be the signature of a dust ring as seen in other galaxies that have suffered recent mergers (such as M 64 or NGC 5128).
The discovery of this great dark lane at low latitudes is of particular interest for studies of Galactic structure. The existing literature does not contain reports of such a great dark lane (great in scale height and extended across the whole bulge), and detailed maps and modeling are needed to test this important Galactic feature.
Athanassoula (1992) studied and modeled the existence and shapes of gas and dust in barred bulges and showed the presence of shocks with velocity jumps and characteristic shapes. These large-scale dust lanes are located at both sides of the bar and are leading (as opposed to the spiral arms, which are trailing). The characteristics of the bulge great dark lane observed here need to be tested against the predictions of models of barred galaxies such as the Milky Way (Athanassoula 1992; Fux 1999; Rodriguez-Fernandez et al. 2006; Rodriguez-Fernandez & Combes 2008; Maciejewski & Athanassoula 2008; Baba et al. 2010).
This result is relevant for the interpretation of microlensing events, where microlensing sources in front of the bulge great dark lane are brighter in optical passbands than sources behind it. In one specific field we found that the difference in magnitudes would be ΔV = 1.8 mag, and depending on the distance to the great dark lane, difference of this magnitude would bias against the detection of microlensing source stars that are located behind it, which would in turn have some effect on microlensing optical depth calculations. The fields where most microlensing events have been detected (e.g., Udalski et al. 2000; Thomas et al. 2004; Popowski et al. 2005) lie in the direction where we see the bulge great dark lane.
Additional interest for understanding the effect of the bulge great dark lane arises for attempts to estimate the age of the bulge
stellar population. Traditionally, ages have been determined using deep CMDs of clear bulge windows (e.g., Baade’s window, SWWEPS field), which yield old ages (e.g., Ortolani et al. 2003; Clarkson et al. 2011; Valenti et al. 2013), but the measurement of ages for inner fields have been complicated by increased extinction and crowding.
Clearly, the bulge great dark lane presented here needs to be mapped in greater detail to understand its distance, geometry, and effects on stellar population and Galactic structure studies and microlensing studies.
Acknowledgments
We gratefully acknowledge use of data from the ESO Public Survey programme ID 179.B-2002 taken with the VISTA Telescope, and data products from the Cambridge Astronomical Survey Unit, and funding from the BASAL-CATA Center for Astrophysics and Associated Technologies PFB-06, Proyecto FONDECYT Regular 1130196, and from the National Science Foundation under Grant PHYS-1066293 and the hospitality of the Aspen Center for Physics. This project is supported by the Ministry for the Economy, Development, and Tourism’s Programa Iniciativa Científica Milenio through grant IC 120009, awarded to the Millennium Institute of Astrophysics (MAS). We warmly thank the ESO Paranal Observatory staff for performing the observations and Mike Irwin, Eduardo Gonzalez-Solares, and Jim Lewis at CASU for pipeline data processing support. R.K.S. acknowledges support from CNPq/Brazil through projects 310636/2013-2 and 481468/2013-7. M.Z. acknowledges support by Proyecto FONDECYT Regular 1110393. J.A. acknowledges support by Proyecto FONDECYT Postdoctoral 3130552. M.C. acknowledges support by Proyecto FONDECYT Regular 1141141.
References
- Alcock, C., Allsman, R. A., Alves, D. R., et al. 2000, ApJ, 541, 734 [NASA ADS] [CrossRef] [Google Scholar]
- Alonso-García, J., Mateo, M., Sen, B., et al. 2012, AJ, 143, 70 [NASA ADS] [CrossRef] [Google Scholar]
- Athanassoula, E. 1992, MNRAS, 259, 345 [NASA ADS] [CrossRef] [Google Scholar]
- Baba, J., Saitoh, T. R., & Wada, K. 2010, PASJ, 62, 1413 [NASA ADS] [Google Scholar]
- Benjamin, R. A., Churchwell, E., Babler, B. L., et al. 2005, ApJ, 630, L149 [NASA ADS] [CrossRef] [Google Scholar]
- Cardelli, J. A., Clayton, G. C., & Mathis, J. S. 1989, ApJ, 345, 245 [NASA ADS] [CrossRef] [Google Scholar]
- Catelan, M., Minniti, D., Lucas, P. W., et al. 2011, in RR Lyrae Stars, Metal-Poor Stars, and the Galaxy, ed. A. McWilliam, 145 [Google Scholar]
- Clarkson, W. I., Sahu, K. C., Anderson, J., et al. 2011, ApJ, 735, 37 [NASA ADS] [CrossRef] [Google Scholar]
- Fux, R. 1999, A&A, 345, 787 [NASA ADS] [Google Scholar]
- Gerhard, O., & Martinez-Valpuesta, I. 2012, ApJ, 744, L8 [NASA ADS] [CrossRef] [Google Scholar]
- Girardi, L., Bressan, A., Bertelli, G., & Chiosi, C. 2000, A&AS, 141, 371 [NASA ADS] [CrossRef] [EDP Sciences] [Google Scholar]
- Gonzalez, O. A., Rejkuba, M., Zoccali, M., Valenti, E., & Minniti, D. 2011, A&A, 534, A3 [NASA ADS] [CrossRef] [EDP Sciences] [Google Scholar]
- Gonzalez, O. A., Rejkuba, M., Zoccali, M., et al. 2013, A&A, 552, A110 [NASA ADS] [CrossRef] [EDP Sciences] [Google Scholar]
- Lucas, P. W., Hoare, M. G., Longmore, A., et al. 2008, MNRAS, 391, 136 [NASA ADS] [CrossRef] [Google Scholar]
- Maciejewski, W., & Athanassoula, E. 2008, MNRAS, 389, 545 [NASA ADS] [CrossRef] [Google Scholar]
- McWilliam, A., & Zoccali, M. 2010, ApJ, 724, 1491 [NASA ADS] [CrossRef] [Google Scholar]
- Minniti, D., Lucas, P. W., Emerson, J. P., et al. 2010, New A, 15, 433 [NASA ADS] [CrossRef] [Google Scholar]
- Nataf, D. M., Udalski, A., Gould, A., Fouqué, P., & Stanek, K. Z. 2010, ApJ, 721, L28 [NASA ADS] [CrossRef] [Google Scholar]
- Nishiyama, S., Tamura, M., Hatano, H., et al. 2009, ApJ, 696, 1407 [NASA ADS] [CrossRef] [Google Scholar]
- Ortolani, S., Bica, E., & Barbuy, B. 2003, A&A, 402, 565 [NASA ADS] [CrossRef] [EDP Sciences] [Google Scholar]
- Popowski, P., Griest, K., Thomas, C. L., et al. 2005, ApJ, 631, 879 [NASA ADS] [CrossRef] [Google Scholar]
- Rattenbury, N. J., Mao, S., Sumi, T., & Smith, M. C. 2007, MNRAS, 378, 1064 [NASA ADS] [CrossRef] [Google Scholar]
- Rodriguez-Fernandez, N. J., & Combes, F. 2008, A&A, 489, 115 [NASA ADS] [CrossRef] [EDP Sciences] [Google Scholar]
- Rodriguez-Fernandez, N. J., Combes, F., Martin-Pintado, J., Wilson, T. L., & Apponi, A. 2006, A&A, 455, 963 [NASA ADS] [CrossRef] [EDP Sciences] [Google Scholar]
- Saito, R. K., Zoccali, M., McWilliam, A., et al. 2011, AJ, 142, 76 [NASA ADS] [CrossRef] [Google Scholar]
- Saito, R. K., Minniti, D., Dias, B., et al. 2012, A&A, 544, A147 [NASA ADS] [CrossRef] [EDP Sciences] [Google Scholar]
- Schechter, P. L., Mateo, M., & Saha, A. 1993, PASP, 105, 1342 [NASA ADS] [CrossRef] [Google Scholar]
- Schultheis, M., Chen, B. Q., Jiang, B. W., et al. 2014, A&A, 566, A120 [NASA ADS] [CrossRef] [EDP Sciences] [Google Scholar]
- Stanek, K. Z., Mateo, M., Udalski, A., et al. 1994, ApJ, 429, L73 [NASA ADS] [CrossRef] [Google Scholar]
- Thomas, C. L., Griest, K., Popowski, P., et al. 2004, in Am. Astron. Soc. Meet. Abstr. BA&AS, 36, 1391 [NASA ADS] [Google Scholar]
- Udalski, A., Zebrun, K., Szymanski, M., et al. 2000, Acta Astron., 50, 1 [NASA ADS] [Google Scholar]
- Udalski, A., Szymanski, M., Kubiak, M., et al. 2002, Acta Astron., 52, 217 [NASA ADS] [Google Scholar]
- Valenti, E., Zoccali, M., Renzini, A., et al. 2013, A&A, 559, A98 [NASA ADS] [CrossRef] [EDP Sciences] [Google Scholar]
- Vásquez, S., Zoccali, M., Hill, V., et al. 2013, A&A, 555, A91 [NASA ADS] [CrossRef] [EDP Sciences] [Google Scholar]
- Wegg, C., & Gerhard, O. 2013, MNRAS, 435, 1874 [Google Scholar]
- Zoccali, M., Hill, V., Lecureur, A., et al. 2008, A&A, 486, 177 [NASA ADS] [CrossRef] [EDP Sciences] [Google Scholar]
All Figures
|
Fig. 1 Ks vs. (Z − Ks) color–magnitude diagram of 66 million stars from 300 sqdeg in the bulge. This Hess CMD is very useful because it reveals in an unprecedented way very faint features, the complexity of the population, the effects of reddening, and the range of magnitudes and colors throughout the whole Milky Way bulge. Particularly interesting is the double peak of the red giant clump at Ks ~ 13.2 mag, separated by Δ(Z − Ks) = 0.55 mag. This is an evidence of the great dark lane across the Milky Way bulge. Completeness in the inner regions only becomes a problem for Ks> 16 mag. The reddening vector is associated with an extinction of E(B − V) = 1, based on the relative extinctions of the VISTA filters, and assuming the extinction law of Cardelli et al. (1989). Contour lines mark density levels in steps of 2% from the highest density. The source density is indicated in the vertical bar on the right, in units of 106 sources mag-2. |
| In the text | |
|
Fig. 2 Left panel: spatial distribution of stars in the blue RC with 12.8 <Ks< 13.5 and 1.5 < (Z − Ks) < 2.0. Right panel: spatial distribution of stars in the red RC with 12.8 <Ks< 13.5 and (Z − Ks) > 2.1. These stars trace the location of the bulge dark lane. The innermost dark region with −1 <b< + 1 is populated by much more reddened RC giants and thus is affected by completeness. The source density is indicated in the vertical bar on the right, in units of 103 sources deg-2. |
| In the text | |
|
Fig. 3 Data from PSF photometry. Left: Y vs. (Z − Y) CMD of one chip of the tile b305 centered at (l,b) = −0.6, −1.9 showing no double clump at more optical wavelengths due to extinction. Middle: Ks vs. (J − Ks) CMD for the same stars showing the double clump due to extinction. This is the observed CMD, it is not dereddened. Right: (Z − Y) vs. (J − Ks) color−color diagram for stars with clump giant magnitudes 13.0 <Ks< 13.6. The reddening vector in each panel is associated with an extinction of E(B − V) = 1, based on the relative extinctions of the VISTA filters, and assuming the extinction law of Cardelli et al. (1989). |
| In the text | |
|
Fig. 4 Ks vs. (Z − Ks) color–magnitude diagrams for the region around the red clump position. In the top panel we show data for −6°<l< −2°, in the bottom panel data for the region + 2°<l< + 6°. The dashed lines mark the slope of reddening vectors based on the relative extinctions of the VISTA filters, and assuming the extinction law of Cardelli et al. (1989). Contour lines mark density levels in steps of 5% from the highest density. |
| In the text | |
Current usage metrics show cumulative count of Article Views (full-text article views including HTML views, PDF and ePub downloads, according to the available data) and Abstracts Views on Vision4Press platform.
Data correspond to usage on the plateform after 2015. The current usage metrics is available 48-96 hours after online publication and is updated daily on week days.
Initial download of the metrics may take a while.