Fig. 4
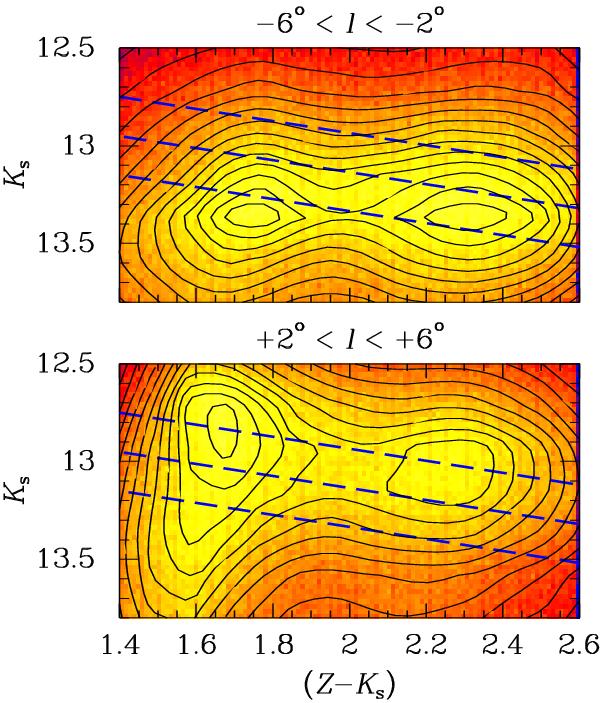
Ks vs. (Z − Ks) color–magnitude diagrams for the region around the red clump position. In the top panel we show data for −6°<l< −2°, in the bottom panel data for the region + 2°<l< + 6°. The dashed lines mark the slope of reddening vectors based on the relative extinctions of the VISTA filters, and assuming the extinction law of Cardelli et al. (1989). Contour lines mark density levels in steps of 5% from the highest density.
Current usage metrics show cumulative count of Article Views (full-text article views including HTML views, PDF and ePub downloads, according to the available data) and Abstracts Views on Vision4Press platform.
Data correspond to usage on the plateform after 2015. The current usage metrics is available 48-96 hours after online publication and is updated daily on week days.
Initial download of the metrics may take a while.