Fig. 2
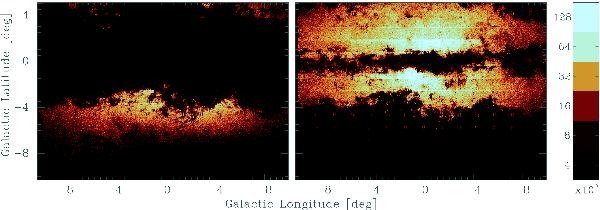
Left panel: spatial distribution of stars in the blue RC with 12.8 <Ks< 13.5 and 1.5 < (Z − Ks) < 2.0. Right panel: spatial distribution of stars in the red RC with 12.8 <Ks< 13.5 and (Z − Ks) > 2.1. These stars trace the location of the bulge dark lane. The innermost dark region with −1 <b< + 1 is populated by much more reddened RC giants and thus is affected by completeness. The source density is indicated in the vertical bar on the right, in units of 103 sources deg-2.
Current usage metrics show cumulative count of Article Views (full-text article views including HTML views, PDF and ePub downloads, according to the available data) and Abstracts Views on Vision4Press platform.
Data correspond to usage on the plateform after 2015. The current usage metrics is available 48-96 hours after online publication and is updated daily on week days.
Initial download of the metrics may take a while.