Fig. 8
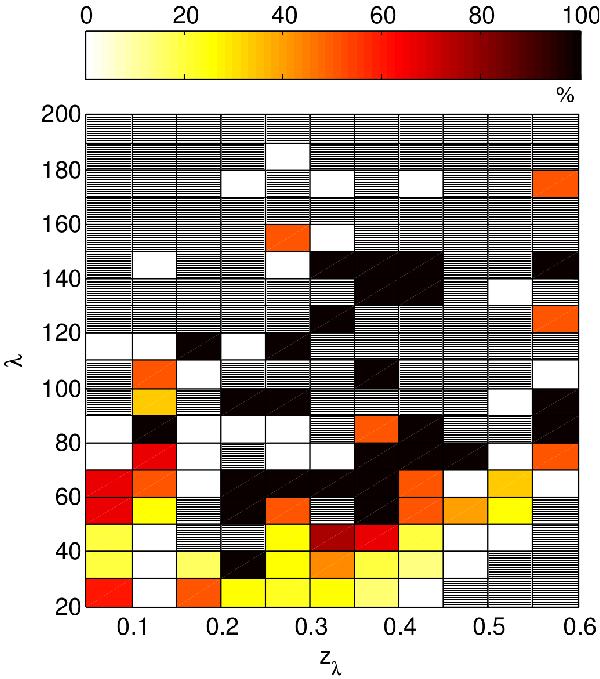
Distribution of the redMaPPer clusters detected as XC1, as a function of richness and redshift. In total, 92 matches with C1 X-ray clusters for 270 input redMaPPers are found within a radius of 1′. A posteriori recovered correlations are not included in this plot (see Fig. 14 for a complete census). Colour coding gives the percentage of redMaPPer detected as C1 in each diagram pixel; greyed pixels stand for redshift-richness combinations not present in the input OPT→X catalogue (Fig. 3)
Current usage metrics show cumulative count of Article Views (full-text article views including HTML views, PDF and ePub downloads, according to the available data) and Abstracts Views on Vision4Press platform.
Data correspond to usage on the plateform after 2015. The current usage metrics is available 48-96 hours after online publication and is updated daily on week days.
Initial download of the metrics may take a while.