Free Access
Fig. 5
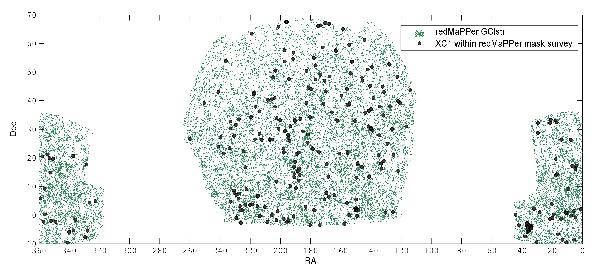
Overall area encompassed by the redMaPPer catalogue (BOSS survey) is mapped by the green dot distribution as in Fig. 4. The black points show the 355 XC1+ clusters that have passed the redMaPPer area masking (exclusion of “bad” fields and of the vicinity of bright stars).
Current usage metrics show cumulative count of Article Views (full-text article views including HTML views, PDF and ePub downloads, according to the available data) and Abstracts Views on Vision4Press platform.
Data correspond to usage on the plateform after 2015. The current usage metrics is available 48-96 hours after online publication and is updated daily on week days.
Initial download of the metrics may take a while.