Free Access
Fig. 20
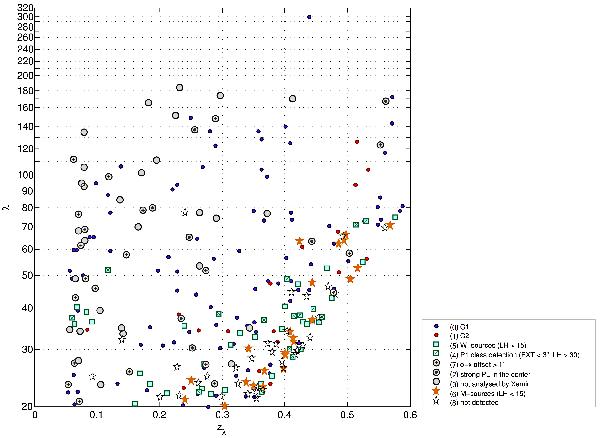
redshift-richness diagramme summarizing the X-ray properties of the redMaPPer clusters (sample OPT→X). Matching categories are numbered following the list presented in Sect. 4.2. The “undetected” cluster located at redshift =0.24 and richness =77 is shown in Fig. 19.
Current usage metrics show cumulative count of Article Views (full-text article views including HTML views, PDF and ePub downloads, according to the available data) and Abstracts Views on Vision4Press platform.
Data correspond to usage on the plateform after 2015. The current usage metrics is available 48-96 hours after online publication and is updated daily on week days.
Initial download of the metrics may take a while.