Fig. 11
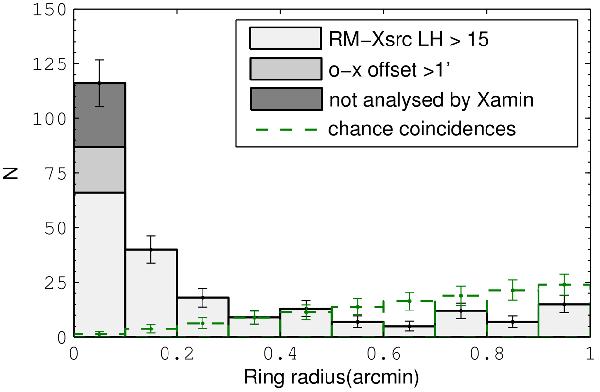
Offsets between the redMaPPer and X-ray source positions (of any type, Det_LH > 15) superposed on the calculated distribution of chance coincidences (computed from the entire population with Det_LH > 15). The breakdown of the 212 matched objects is as follows: light grey histogram: C1 plus categories 1, 2, 4, 5 of Sect. 4.2; medium grey histogram: category 7; dark grey histogram: category 3. Clusters missed because of failures of the X-ray or optical pipelines (categories 3 and 7) but recovered after visual inspection are added in the first bin.
Current usage metrics show cumulative count of Article Views (full-text article views including HTML views, PDF and ePub downloads, according to the available data) and Abstracts Views on Vision4Press platform.
Data correspond to usage on the plateform after 2015. The current usage metrics is available 48-96 hours after online publication and is updated daily on week days.
Initial download of the metrics may take a while.