Free Access
Fig. 10
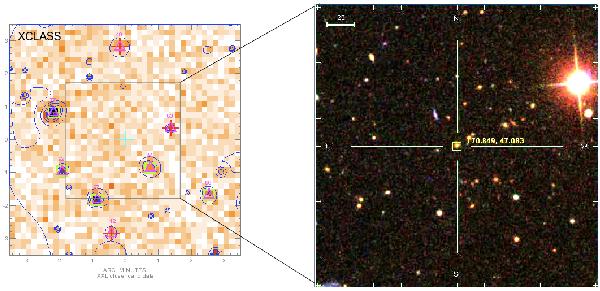
redMaPPer cluster 29357 (zlam = 0.48 and Richness = 44.15). Left panel: 7′ × 7′ [0.5−2] keV photon image; green squares stand for point sources and red crosses for detections below the significance level (Det_LH< 15); Right panel: corresponding SDSS DR9 color 3′ × 3′ image.
Current usage metrics show cumulative count of Article Views (full-text article views including HTML views, PDF and ePub downloads, according to the available data) and Abstracts Views on Vision4Press platform.
Data correspond to usage on the plateform after 2015. The current usage metrics is available 48-96 hours after online publication and is updated daily on week days.
Initial download of the metrics may take a while.