Fig. 22
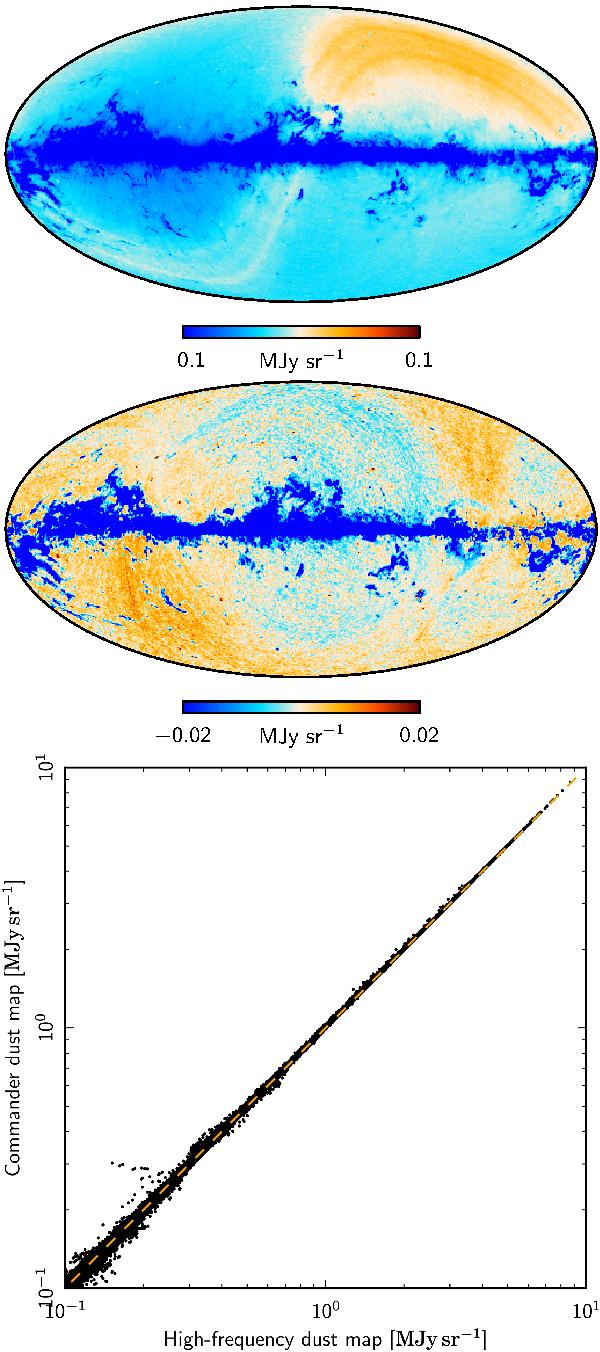
Top: difference map between the thermal dust amplitude at 353 GHz presented in this paper using the Planck 30 to 353 GHz frequencies, and that derived by Planck Collaboration XI (2014) using only the Planck 353, 545 and 857 GHz channels and the 100 μm IRIS map. Both maps are smoothed to a common resolution of 40′. Middle: the same difference map, but accounting for relative monopole, dipole and zodiacal emission treatment. Bottom: T–T plot between the same two maps after applying relative corrections. Any pixels with a CO amplitude at 100 GHz larger than 1 K km s-1 are removed from this plot.
Current usage metrics show cumulative count of Article Views (full-text article views including HTML views, PDF and ePub downloads, according to the available data) and Abstracts Views on Vision4Press platform.
Data correspond to usage on the plateform after 2015. The current usage metrics is available 48-96 hours after online publication and is updated daily on week days.
Initial download of the metrics may take a while.