Fig. 21
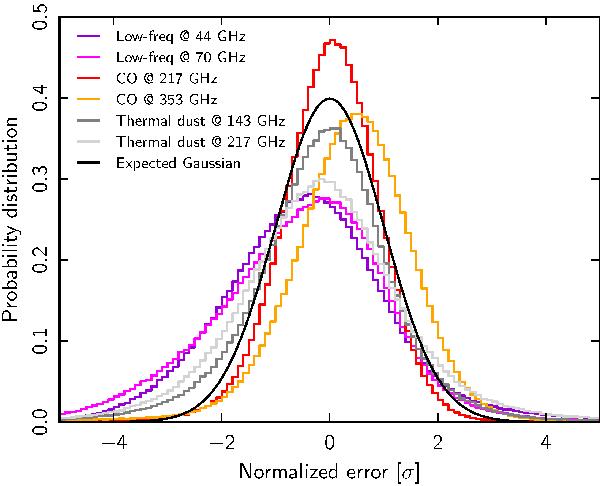
Validation of spectral parameters for low-frequency foregrounds, thermal dust, and CO emission, evaluated from the FFP6 simulation. Each histogram shows the error distribution at the two leading sub-dominant frequencies in the form of the normalized errors δ = (Aout(ν) − Ain(ν)) /σout(ν) for all pixels outside the Commander likelihood analysis mask, where Aout(ν) is the predicted foreground amplitude at frequency ν given the estimated amplitude and spectral parameters, and σout(ν) is the corresponding standard deviation computed over the sample set.
Current usage metrics show cumulative count of Article Views (full-text article views including HTML views, PDF and ePub downloads, according to the available data) and Abstracts Views on Vision4Press platform.
Data correspond to usage on the plateform after 2015. The current usage metrics is available 48-96 hours after online publication and is updated daily on week days.
Initial download of the metrics may take a while.