Fig. 20
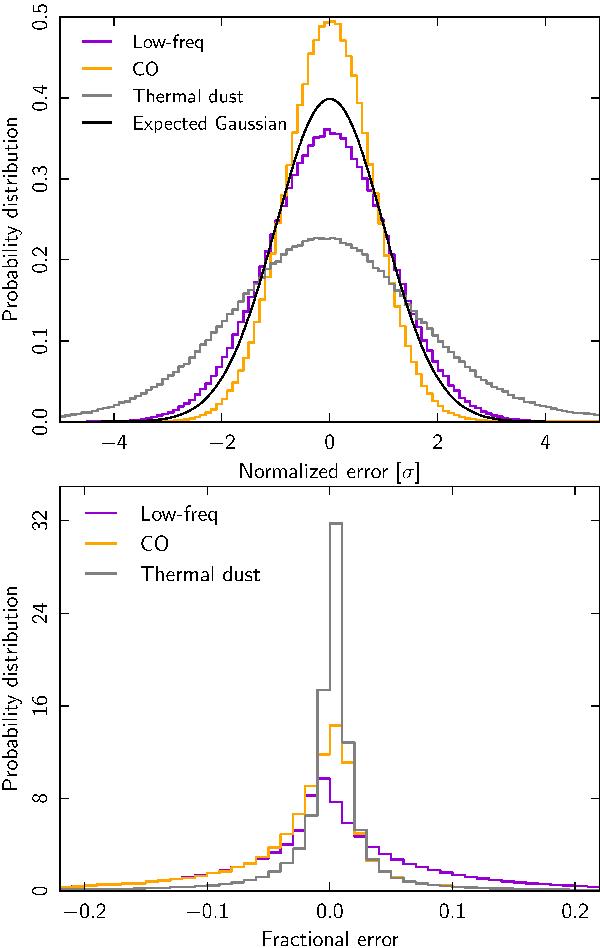
Error validation for component amplitudes, evaluated from the FFP6 simulation. The upper panel shows histograms of the normalized errors δ = (Aout − Ain) /σout for the three foreground components and including all pixels outside the Commander likelihood analysis mask. The lower panel shows histograms of the fractional error f ≡ (Aout − Ain) /Ain for pixels with a foreground detection level above 5σ. No evidence of significant bias is observed for any component, and the uncertainty estimates for the low-frequency and CO components are accurate to about 12%; the thermal dust uncertainty is underestimated by a factor of 2 due to the presence of unmodelled fluctuations.
Current usage metrics show cumulative count of Article Views (full-text article views including HTML views, PDF and ePub downloads, according to the available data) and Abstracts Views on Vision4Press platform.
Data correspond to usage on the plateform after 2015. The current usage metrics is available 48-96 hours after online publication and is updated daily on week days.
Initial download of the metrics may take a while.