Fig. 19
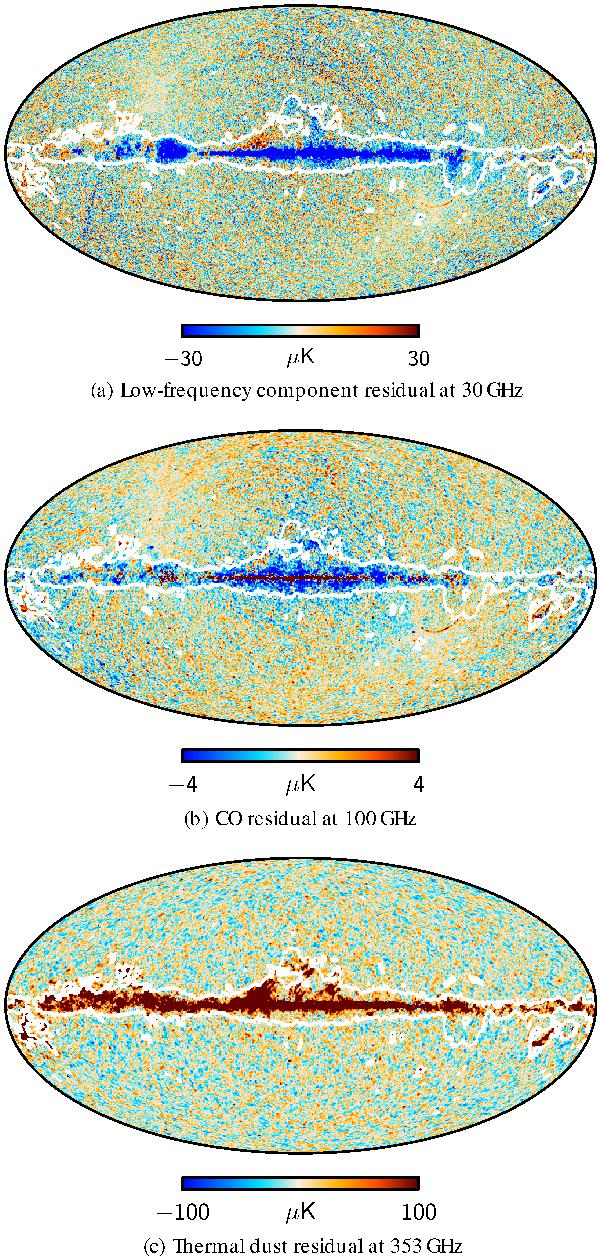
Amplitude residual maps, Aout − Ain, computed blindly from the FFP6 simulation. The panels show (from top to bottom) the low-frequency residual at 30 GHz, the CO residual at 100 GHz and the thermal dust residual at 353 GHz. All units are thermodynamic μK. The white lines indicate the boundary of the Commander likelihood analysis mask, removing 13% of the sky.
Current usage metrics show cumulative count of Article Views (full-text article views including HTML views, PDF and ePub downloads, according to the available data) and Abstracts Views on Vision4Press platform.
Data correspond to usage on the plateform after 2015. The current usage metrics is available 48-96 hours after online publication and is updated daily on week days.
Initial download of the metrics may take a while.