Fig. 16
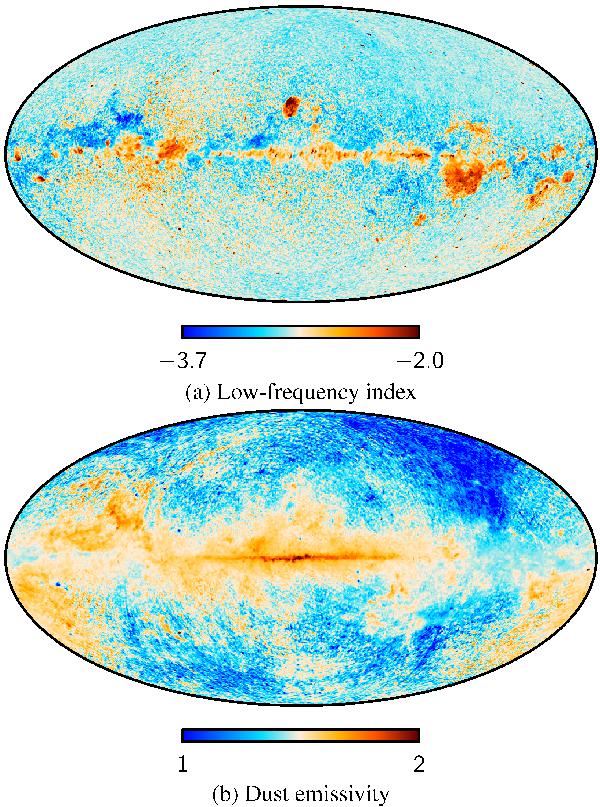
Posterior mean spectral parameter maps derived from the low-resolution analysis. The top panel shows the power law index of the low-frequency component, and the bottom panel shows the emissivity index of the one-component thermal dust model. Note that the systematic error due to monopole and dipole uncertainties is significant for the dust emissivity in regions with a low thermal dust amplitude.
Current usage metrics show cumulative count of Article Views (full-text article views including HTML views, PDF and ePub downloads, according to the available data) and Abstracts Views on Vision4Press platform.
Data correspond to usage on the plateform after 2015. The current usage metrics is available 48-96 hours after online publication and is updated daily on week days.
Initial download of the metrics may take a while.