Free Access
Fig. 23
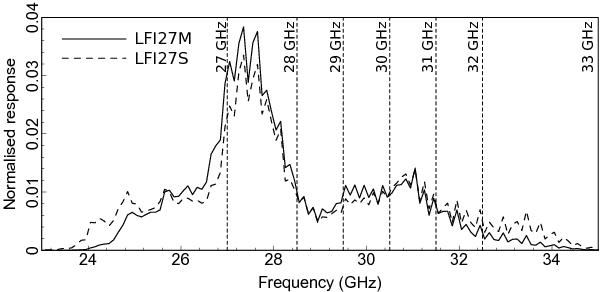
Bandpass response of the two radiometers of the LFI27 receiver. The figure shows the seven frequency intervals and the corresponding frequencies at which sidelobes have been simulated. For each interval the weight is the integral of the bandpass response curve.
Current usage metrics show cumulative count of Article Views (full-text article views including HTML views, PDF and ePub downloads, according to the available data) and Abstracts Views on Vision4Press platform.
Data correspond to usage on the plateform after 2015. The current usage metrics is available 48-96 hours after online publication and is updated daily on week days.
Initial download of the metrics may take a while.