Fig. 1
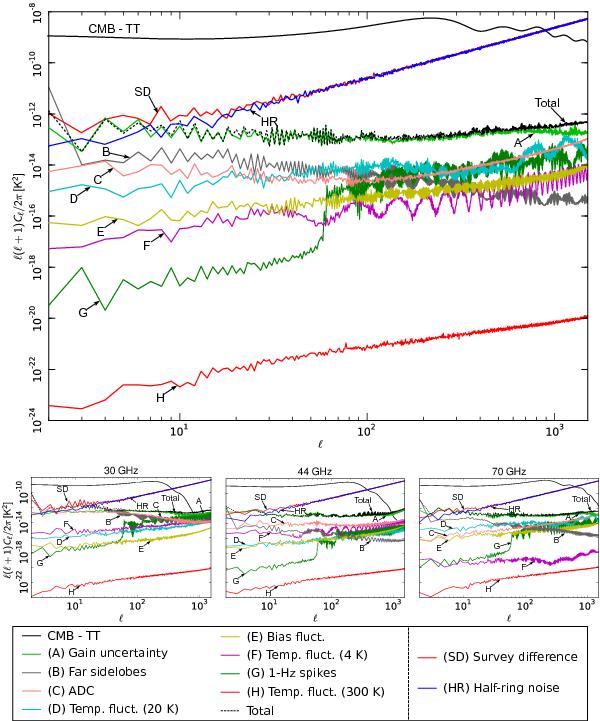
Angular power spectra of the various systematic effects compared to the Planck temperature anisotropy spectrum. The black dashed curve, representing the total contribution, has been derived from a map where all the systematic effects have been summed. Top panel: power spectra obtained from frequency independent maps resulting from the weighted-average of individual systematic effect frequency maps. Bottom panel: contributions of systematic effects from individual frequency maps. The CMB curve corresponds to the Planck best-fit model presented in Planck Collaboration XV (2014). In the bottom panels the CMB spectrum has been filtered by the beam window function for each frequency.
Current usage metrics show cumulative count of Article Views (full-text article views including HTML views, PDF and ePub downloads, according to the available data) and Abstracts Views on Vision4Press platform.
Data correspond to usage on the plateform after 2015. The current usage metrics is available 48-96 hours after online publication and is updated daily on week days.
Initial download of the metrics may take a while.