Fig. 8
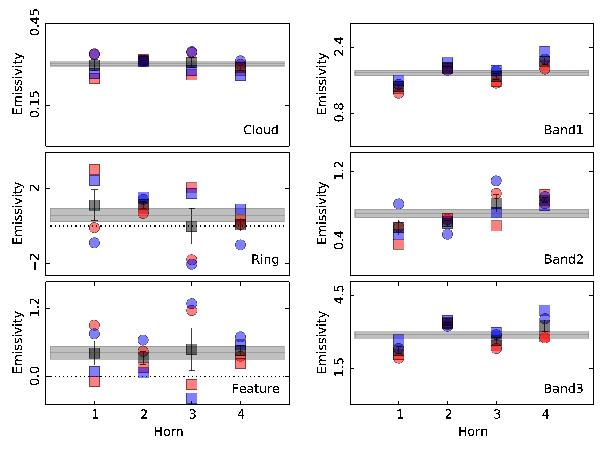
Emissivities of components from fits at 857 GHz. Fits to the first year of Planck observations are in red, divided into Survey 1 (circles) and Survey 2 (squares). Fits to the second year are in blue, divided into Survey 3 (circles) and Survey 4 (squares). Absent time variability of the zodiacal emission, little difference would be expected between corresponding red and blue symbols. Agreement or disagreement between squares and circles gives some indication of systematic errors in the data and the correctness of the templates. The average of all measurements for each horn is shown as a black square, and the average and standard errors for the entire frequency, is given by the horizontal grey band. Dotted lines mark zero levels where appropriate. Similar plots for all HFI frequencies can be found in the Planck Explanatory Supplement (Planck Collaboration 2013).
Current usage metrics show cumulative count of Article Views (full-text article views including HTML views, PDF and ePub downloads, according to the available data) and Abstracts Views on Vision4Press platform.
Data correspond to usage on the plateform after 2015. The current usage metrics is available 48-96 hours after online publication and is updated daily on week days.
Initial download of the metrics may take a while.