Fig. 6
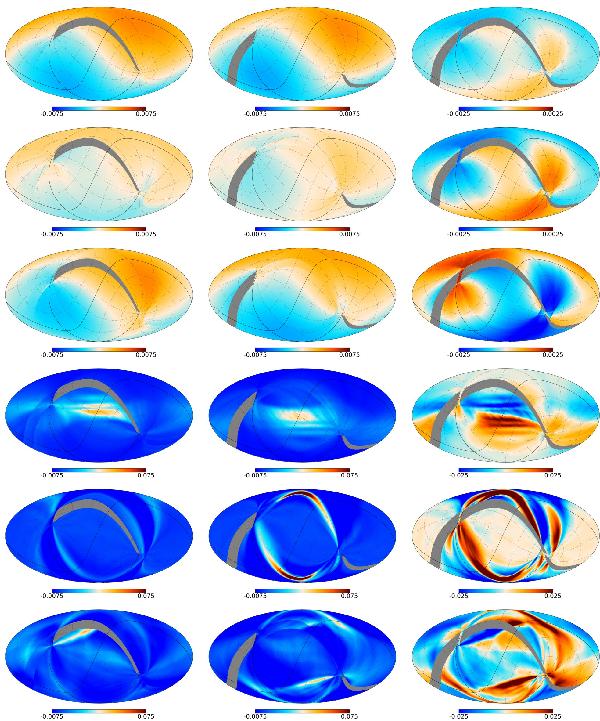
Templates of the dipole and the Galaxy, in MJy/sr, seen through our far sidelobes for Surveys 1 (left) and 2 (centre), and for the difference in these two (right). Row 1: dipole seen through the direct SR contribution. Row 2: dipole seen through the PR contribution. Row 3: dipole seen through the baffle SR contribution. Row 4: galaxy seen through the direct SR contribution. Row 5: galaxy seen through the PR contribution. Row 6: galaxy seen through the baffle SR contribution. The simulations in Rows 4–6 are made using 857 GHz data passed through the far sidelobe calculation described in Sect. 4.2. The scales are different for the top and bottom three rows, and for the first two and the last columns.
Current usage metrics show cumulative count of Article Views (full-text article views including HTML views, PDF and ePub downloads, according to the available data) and Abstracts Views on Vision4Press platform.
Data correspond to usage on the plateform after 2015. The current usage metrics is available 48-96 hours after online publication and is updated daily on week days.
Initial download of the metrics may take a while.