Fig. A.2
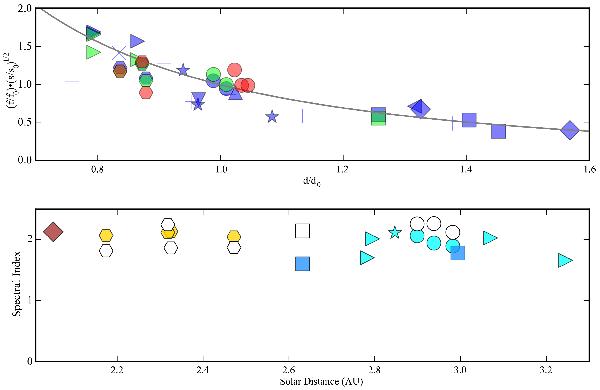
Top: ratio of fs1 / 2 of the first and subsequent measurements for those solar system objects that were detected in more than one survey. Measurements at 857 GHz are shown in blue, measurements at 545 GHz are shown in green, and measurements at 353 GHz are shown in red. The grey line shows ![]() , which one would expect for Rayleigh-Jeans objects. Bottom: spectral index for those asteroids detected in multiple frequency bands for a given survey, defined as
, which one would expect for Rayleigh-Jeans objects. Bottom: spectral index for those asteroids detected in multiple frequency bands for a given survey, defined as ![]() . Juno and Vesta are shown in brown and yellow, to indicate that they have different spectral classifications than Ceres, Pallas, Hygiea and Europa, shown in shades of blue. The white symbols show the corresponding values for 353–545 GHz, where they exist. For both panels, the symbols used for each object are: 1 Ceres – circles; 2 Pallas – squares; 3 Juno – diamonds; 4 Vesta – hexagons; 6 Hebe – +; 8 Flora – ×; 9 Metis – upward-pointing triangle; 10 Hygiea – right-pointing triangles; 19 Fortuna – vertical lines; 45 Eugenia – downward-pointing triangles; 52 Europa – stars; 324 Bamberga – left-pointing triangle; and 704 Interamnia – horizontal lines.
. Juno and Vesta are shown in brown and yellow, to indicate that they have different spectral classifications than Ceres, Pallas, Hygiea and Europa, shown in shades of blue. The white symbols show the corresponding values for 353–545 GHz, where they exist. For both panels, the symbols used for each object are: 1 Ceres – circles; 2 Pallas – squares; 3 Juno – diamonds; 4 Vesta – hexagons; 6 Hebe – +; 8 Flora – ×; 9 Metis – upward-pointing triangle; 10 Hygiea – right-pointing triangles; 19 Fortuna – vertical lines; 45 Eugenia – downward-pointing triangles; 52 Europa – stars; 324 Bamberga – left-pointing triangle; and 704 Interamnia – horizontal lines.
Current usage metrics show cumulative count of Article Views (full-text article views including HTML views, PDF and ePub downloads, according to the available data) and Abstracts Views on Vision4Press platform.
Data correspond to usage on the plateform after 2015. The current usage metrics is available 48-96 hours after online publication and is updated daily on week days.
Initial download of the metrics may take a while.