Fig. A.1
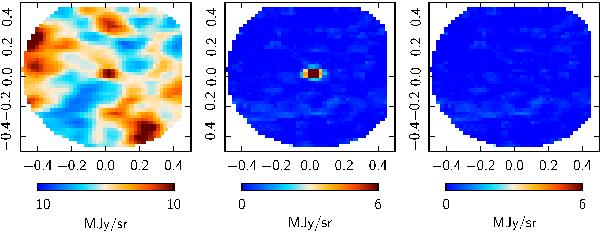
Example PSF fitting. Background removal and fitting are done in the time domain, bolometer by bolometer. These stacked maps were created only for visualization. Left: stacked data for the second observation season of 1 Ceres at 857 GHz, before background removal. Center: stacked data after background removal. Right: stacked data after background and source removal.
Current usage metrics show cumulative count of Article Views (full-text article views including HTML views, PDF and ePub downloads, according to the available data) and Abstracts Views on Vision4Press platform.
Data correspond to usage on the plateform after 2015. The current usage metrics is available 48-96 hours after online publication and is updated daily on week days.
Initial download of the metrics may take a while.