Fig. 13
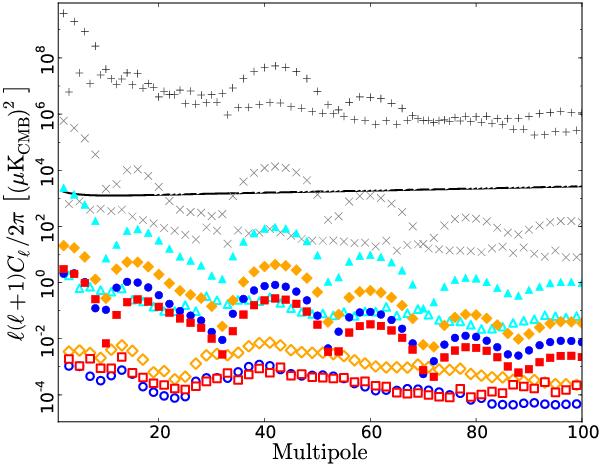
Power spectra of the zodiacal correction maps shown in Fig. 12. Black plus signs = 857 GHz; grey crosses = 545 GHz; cyan triangles = 353 GHz; orange diamonds = 217 GHz; blue circles = 143 GHz; and red squares = 100 GHz. For the “CMB channels” 100–353 GHz, even multipoles are shown with filled symbols, odd multipoles with empty symbols. The “even-odd” pattern is a consequence of the symmetry around the ecliptic plane – odd multipoles are almost absent, as they would indicate structure in the maps that was anti-symmetric about the ecliptic plane. The best-fit ΛCDM CMB temperature anisotropy spectrum using the “Planck+WP+highL+BAO” data combination from Planck Collaboration XVI (2014), is shown as the solid line roughly half-way down the plot, orders of magnitude above the zodiacal spectrum in the Planck CMB channels.
Current usage metrics show cumulative count of Article Views (full-text article views including HTML views, PDF and ePub downloads, according to the available data) and Abstracts Views on Vision4Press platform.
Data correspond to usage on the plateform after 2015. The current usage metrics is available 48-96 hours after online publication and is updated daily on week days.
Initial download of the metrics may take a while.