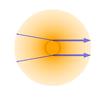
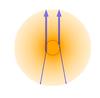
Fig. 1
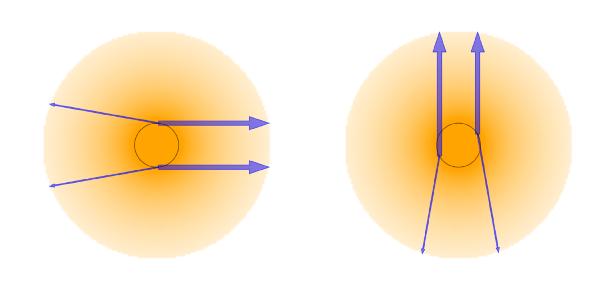
Schematic representation of the geometry of Planck’s measurements, which shows that it can view different amounts of zodiacal emission while looking at the same point on the distant sky. Observations of two points on the sky are shown, each with two measurements of the given point. The plane of the Ecliptic is in the plane of the diagram. The Sun is in the centre of each panel. The solid black ring represents the orbit of the Earth and Planck. The orange circle represents the IPD cloud, cut off at the orbit of Jupiter, beyond which we assume there is no contribution to the zodiacal emission. Left: case where the phase of the scan cycloid and the location of the observed point on the sky (towards the right of the page in this case) yield two measurements for which the lines of sight through the IPD are roughly equal, and the same zodiacal signal is seen. Right: case where the phase of the scan cycloid and the location of the observed point on the sky (now towards the top of the page) yield different total columns of IPD along the lines of sight, and thus a different zodiacal signal. Note that this figure is highly stylized and not to scale.
Current usage metrics show cumulative count of Article Views (full-text article views including HTML views, PDF and ePub downloads, according to the available data) and Abstracts Views on Vision4Press platform.
Data correspond to usage on the plateform after 2015. The current usage metrics is available 48-96 hours after online publication and is updated daily on week days.
Initial download of the metrics may take a while.