Fig. 9
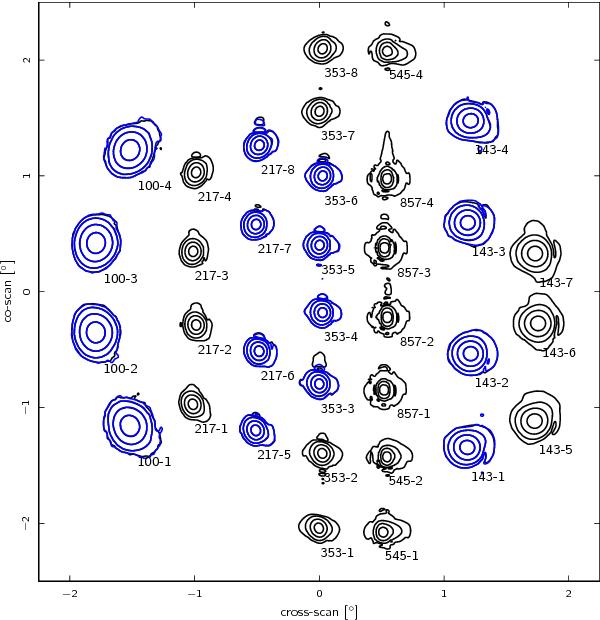
B-spline scanning beams reconstructed from Mars, Saturn, and Jupiter seasons 1, 2 and 3 data for near sidelobe studies. The beams are plotted in logarithmic contours of − 3, − 10, − 20 and − 30 dB from the peak. PSB pairs are indicated with the a bolometer in black and the b bolometer in blue.
Current usage metrics show cumulative count of Article Views (full-text article views including HTML views, PDF and ePub downloads, according to the available data) and Abstracts Views on Vision4Press platform.
Data correspond to usage on the plateform after 2015. The current usage metrics is available 48-96 hours after online publication and is updated daily on week days.
Initial download of the metrics may take a while.