Fig. 7
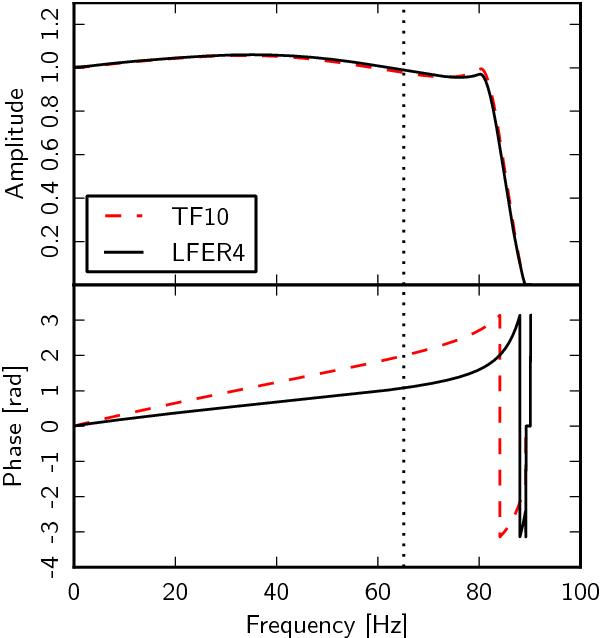
Phase and amplitude as a function of signal frequency of the deconvolution function of bolometer 217-1. The solid black curve is the LFER4 model, while the dashed red curve shows the TF10 model used in the earlier Planck papers. The vertical dotted line marks the signal frequency corresponding to the half power point of the average effective beam.
Current usage metrics show cumulative count of Article Views (full-text article views including HTML views, PDF and ePub downloads, according to the available data) and Abstracts Views on Vision4Press platform.
Data correspond to usage on the plateform after 2015. The current usage metrics is available 48-96 hours after online publication and is updated daily on week days.
Initial download of the metrics may take a while.