Fig. G.2
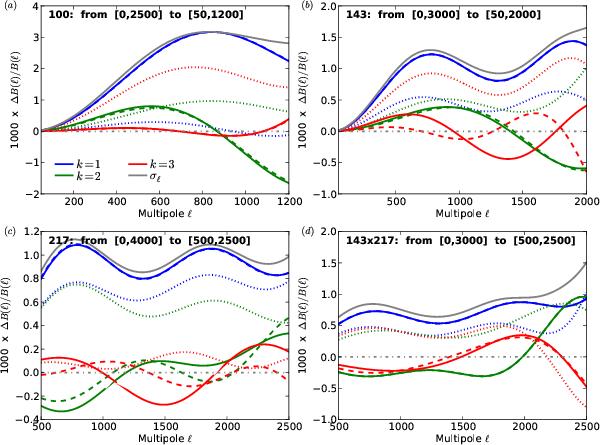
Effect of ℓ truncation on beam error modes for frequency-averaged beam window functions at 100, 143, 217 GHz and 143 × 217. For clarity, only the three leading modes are shown, respectively, in blue, green and red, while the solid grey line shows the 1 σ level, obtained by adding all modes in quadrature. Dotted lines are the original eigenmodes computed on a wide ℓ-range. Solid lines are the eigenmodes computed directly from the MC simulations on the truncated ℓ-range used for cosmological analysis. Dashed lines show the eigenmodes computed on the truncated ℓ-range with Eqs. (G.16) and (G.17), starting from the first five eigenmodes for the wide range. In all four cases considered, the first leading mode on the truncated range, which dominates the error budget, is perfectly reconstructed out of the information available, while the second leading mode is well estimated in all cases except for 217 GHz.
Current usage metrics show cumulative count of Article Views (full-text article views including HTML views, PDF and ePub downloads, according to the available data) and Abstracts Views on Vision4Press platform.
Data correspond to usage on the plateform after 2015. The current usage metrics is available 48-96 hours after online publication and is updated daily on week days.
Initial download of the metrics may take a while.