Fig. G.1
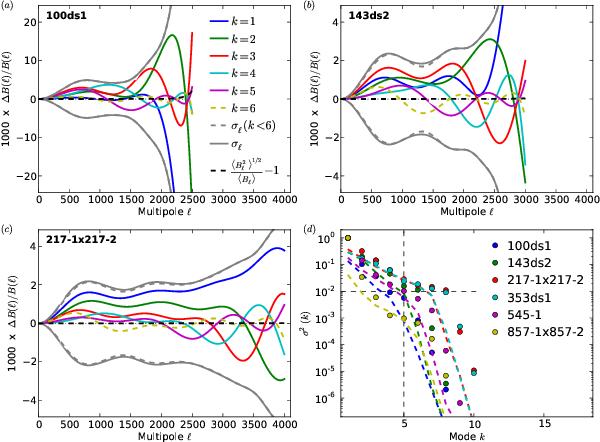
Beam window function error modes. Panels a), b) and
c) show the first six eigenmodes defined in Eq. (G.11) for respectively the effective
auto-beam 100ds1 and 143ds2 and the effective cross-beam 217-1 × 217-2. The first five modes used in
the current beam error modelling are shown as solid coloured curves, while the 6th
mode (the first one to be ignored) appears as yellow dashes. The grey dashes show
the ±1 σ envelope obtained
by adding the first five modes in quadrature, while the solid grey curve is the
±1 σ envelope estimated
from the simulations (therefore including all eigenmodes). The black dashes show the
relative difference between ![]() and Bmean(ℓ) defined in
Eqs. (G.6) and (G.5), respectively. In panel
d), for a selection of effective beams, the coloured symbols show
(dk/d1)2
where dk is the
kth
eigenvalue of the diagonal matrix D (Eq. (G.12)), while the coloured dashes show the error made on the quadratic sum
of the eigenvalues by truncating it to nmodes:
and Bmean(ℓ) defined in
Eqs. (G.6) and (G.5), respectively. In panel
d), for a selection of effective beams, the coloured symbols show
(dk/d1)2
where dk is the
kth
eigenvalue of the diagonal matrix D (Eq. (G.12)), while the coloured dashes show the error made on the quadratic sum
of the eigenvalues by truncating it to nmodes:
![]() . The vertical dashes show the
current nmodes = 5 value.
. The vertical dashes show the
current nmodes = 5 value.
Current usage metrics show cumulative count of Article Views (full-text article views including HTML views, PDF and ePub downloads, according to the available data) and Abstracts Views on Vision4Press platform.
Data correspond to usage on the plateform after 2015. The current usage metrics is available 48-96 hours after online publication and is updated daily on week days.
Initial download of the metrics may take a while.