Fig. 19
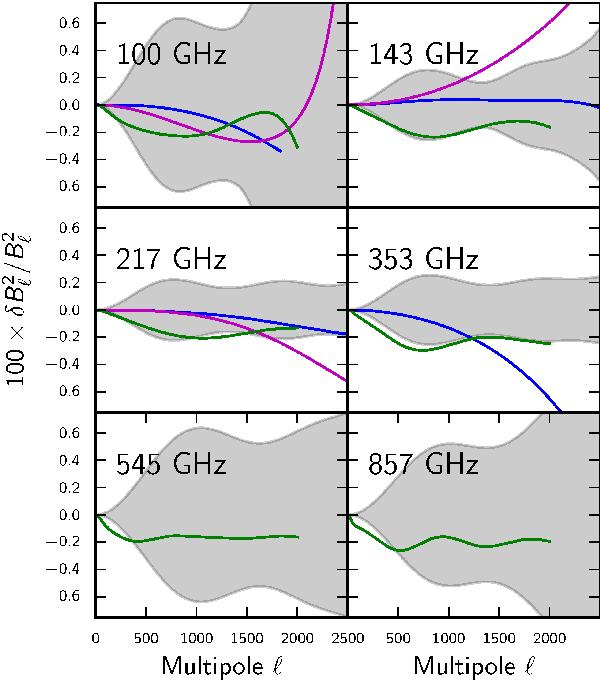
An estimate of known biases in the effective beam window function compared to the RMS statistical error including the additional factor 2.7 (grey shaded region) for each HFI frequency band. Green is the bias due to near sidelobes, blue is the colour-correction bias, and magenta shows an upper limit on the effect of ADC non-linearity.
Current usage metrics show cumulative count of Article Views (full-text article views including HTML views, PDF and ePub downloads, according to the available data) and Abstracts Views on Vision4Press platform.
Data correspond to usage on the plateform after 2015. The current usage metrics is available 48-96 hours after online publication and is updated daily on week days.
Initial download of the metrics may take a while.