Fig. 18
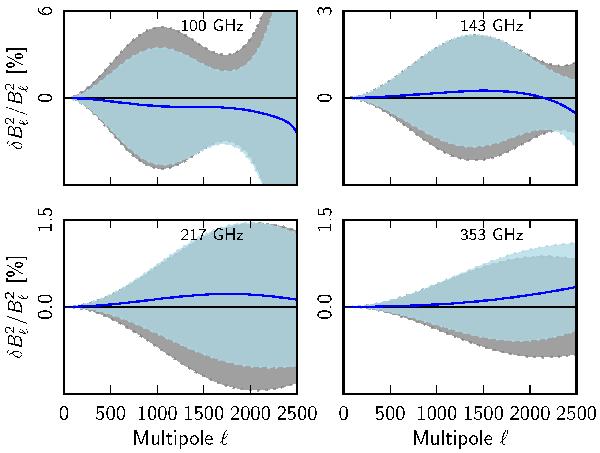
Seasonal consistency of the beams at four HFI frequencies.Thick blue lines show the difference of the Mars season 1 and Mars season 2 window functions normalized to the band-average full window function. The grey shaded band is the ±1σ error for Mars 1 and the blue shaded band is the ±1σ error for Mars 2.
Current usage metrics show cumulative count of Article Views (full-text article views including HTML views, PDF and ePub downloads, according to the available data) and Abstracts Views on Vision4Press platform.
Data correspond to usage on the plateform after 2015. The current usage metrics is available 48-96 hours after online publication and is updated daily on week days.
Initial download of the metrics may take a while.