Free Access
Fig. 13
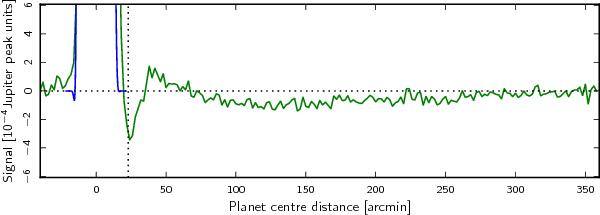
A slice through stacked Jupiter data for bolometer 143-6, illustrating residual long time response after deconvolution. The vertical dotted line shows the extent of the scanning beam map (plotted in blue).
Current usage metrics show cumulative count of Article Views (full-text article views including HTML views, PDF and ePub downloads, according to the available data) and Abstracts Views on Vision4Press platform.
Data correspond to usage on the plateform after 2015. The current usage metrics is available 48-96 hours after online publication and is updated daily on week days.
Initial download of the metrics may take a while.