Fig. 10
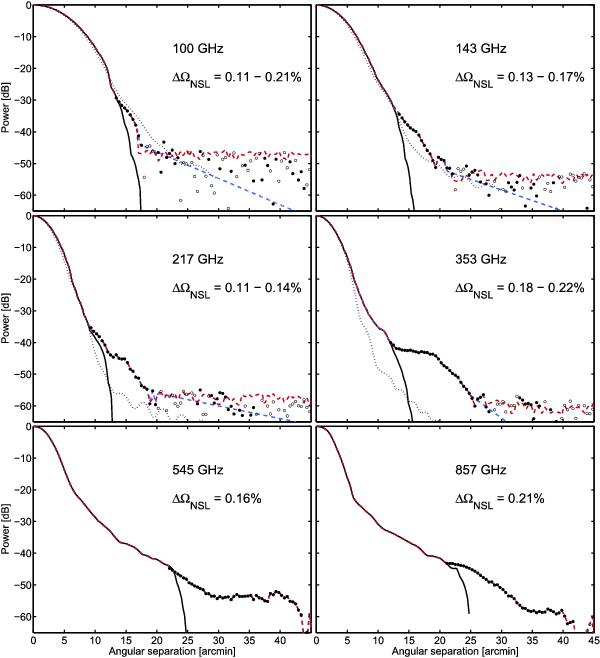
Azimuthally- and band-averaged main beam profiles (black solid curve) derived from the B-spline representation of the first and second Mars observations compared to that derived from a combination of Mars, Jupiter and Saturn observations (filled and open markers represent positive and negative data respectively). The red dashed line is defined as the joint envelope of the main beam and near sidelobe dataset, the integral of which represents the maximal solid angle that is compatible with these data. A nominal near lobe model, provided as a reasonable extrapolation of the data below the noise floor, is shown as the blue dashed line. The fractional increase in solid angle, relative to the Mars-alone derived beam profile, is displayed in each panel. The black dotted line shows the GRASP physical optics model averaged over a subset of detectors that have been simulated (100–353 GHz). The data show a clear excess in power over the model at 143, 217 and 353 GHz that is consistent with a spectrum of surface errors on scales between 2 and 12 cm, with an RMS of order 10 μm. Table 2 contains an estimate of the fraction of the solid angle in the near sidelobes that is not captured in the B-spline representation. For clarity, the figure extends only to 45′. In all cases the solid angle is derived from the profile extending out to 5°. Due to the high signal-to-noise of the Jupiter data (− 40 to − 55 dB, depending on the frequency), and the rapidly falling response of the beam, the solid angle estimates are insensitive to the limit of integration.
Current usage metrics show cumulative count of Article Views (full-text article views including HTML views, PDF and ePub downloads, according to the available data) and Abstracts Views on Vision4Press platform.
Data correspond to usage on the plateform after 2015. The current usage metrics is available 48-96 hours after online publication and is updated daily on week days.
Initial download of the metrics may take a while.