Fig. 6
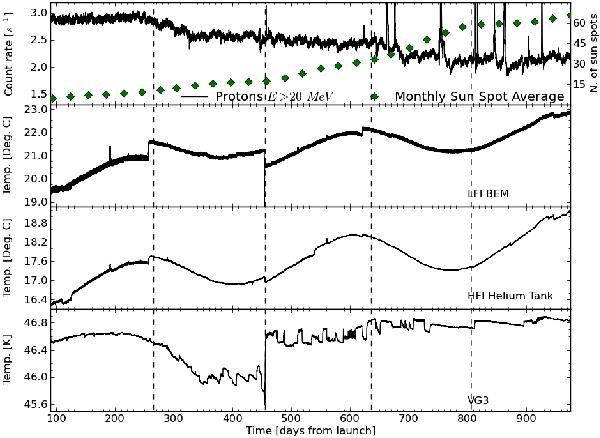
Thermal and radiation environment of Planck. Vertical lines indicate boundaries between Surveys. Top panel: cosmic ray flux as measured by the onboard SREM; its decrease over time is due to the corresponding increase in solar activity, indicated by the sunspot number5. Solar flares show up as spikes in the proton flux. Second and third panels: temperature variation at two representative locations in the room-temperature SVM, i.e., on one of the (HFI) helium tanks and on one of the LFI back-end modules (BEMs). The sine-wave modulation tracks the variation of distance from the Sun. Bottom panel: temperature evolution of VG3, the coldest of three V-grooves, to which the sorption cooler is heat-sunk. The disturbances on the curve are due to adjustments of the operational parameters of this cooler.
Current usage metrics show cumulative count of Article Views (full-text article views including HTML views, PDF and ePub downloads, according to the available data) and Abstracts Views on Vision4Press platform.
Data correspond to usage on the plateform after 2015. The current usage metrics is available 48-96 hours after online publication and is updated daily on week days.
Initial download of the metrics may take a while.