Free Access
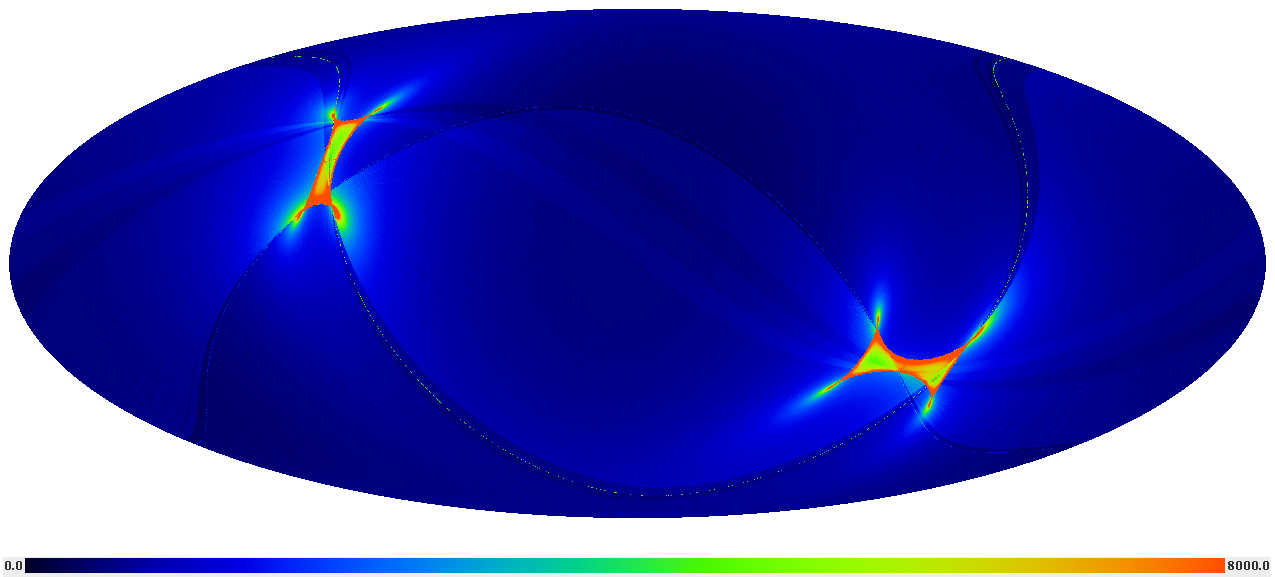
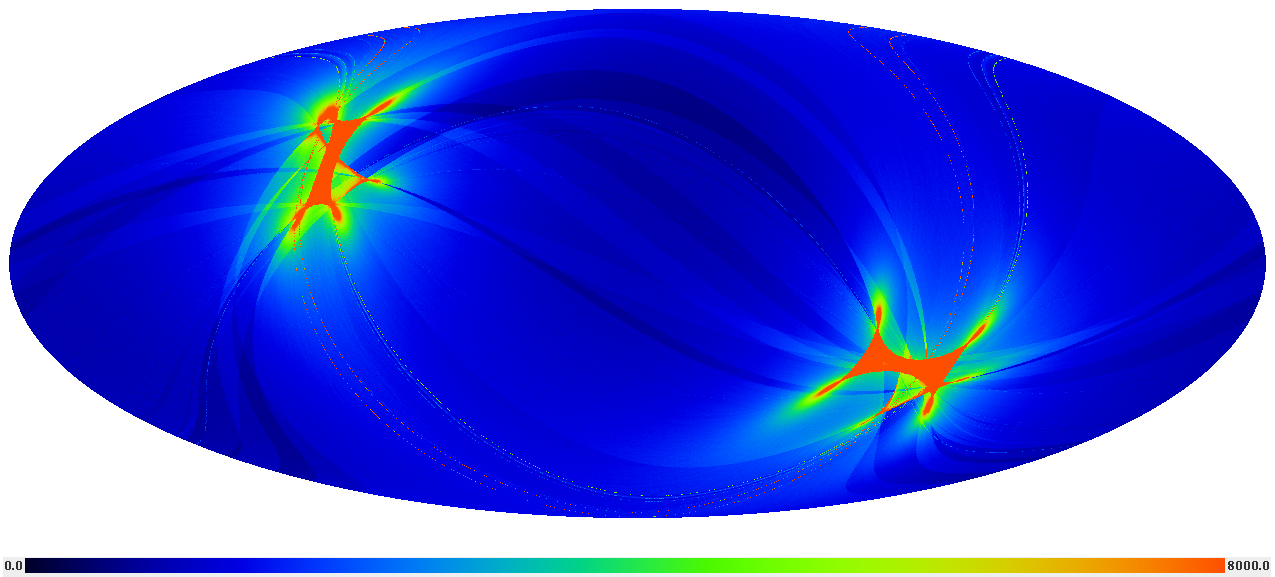
Fig. 5
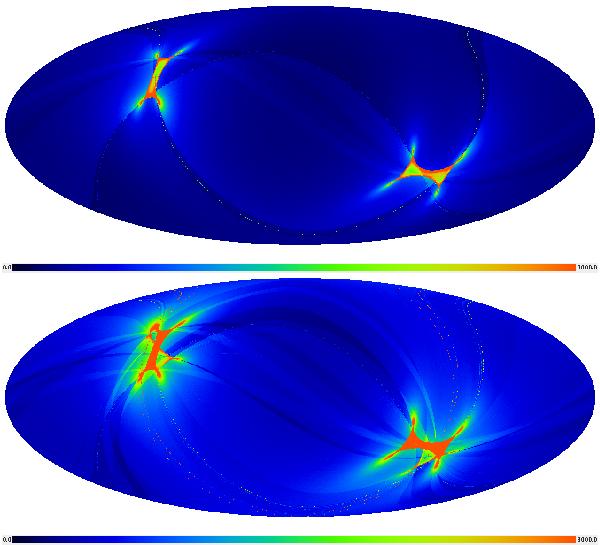
Survey coverage for the nominal (top) and 0.1 K (bottom) missions (see Table 1). The colour scale represents total integration time (varying between 50 and 8000 s deg-2) for the 353 GHz channel. The maps are at Nside = 1024.
This figure is made of several images, please see below:
Current usage metrics show cumulative count of Article Views (full-text article views including HTML views, PDF and ePub downloads, according to the available data) and Abstracts Views on Vision4Press platform.
Data correspond to usage on the plateform after 2015. The current usage metrics is available 48-96 hours after online publication and is updated daily on week days.
Initial download of the metrics may take a while.