Fig. 4
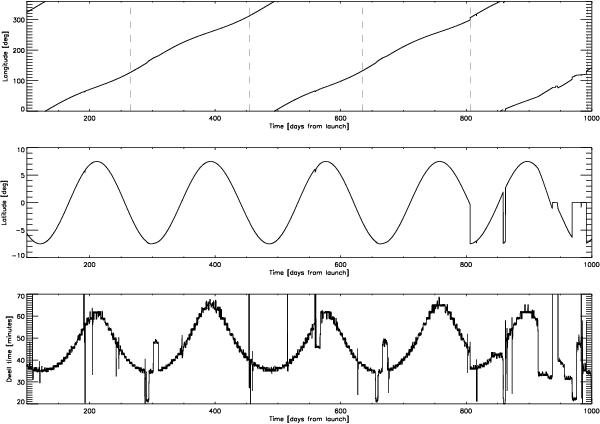
Top two panels: path of the spin axis of Planck (in ecliptic longitude and latitude) over the period 12 August 2009 (91 days after launch) to 13 January 2012, the “0.1 K mission” period (Table 1). Bottom panel: evolution of the dwell time during the same period. Intervals of acceleration/deceleration (e.g., around observations of the Crab) are clearly visible as symmetric temporary increases and reductions of dwell time. Survey boundaries are indicated by vertical dashed lines in the upper plot. The change in cycloid phase is clearly visible at operational day (OD) 807. The disturbances around OD 950 are due to the “spin-up campaign”.
Current usage metrics show cumulative count of Article Views (full-text article views including HTML views, PDF and ePub downloads, according to the available data) and Abstracts Views on Vision4Press platform.
Data correspond to usage on the plateform after 2015. The current usage metrics is available 48-96 hours after online publication and is updated daily on week days.
Initial download of the metrics may take a while.