Fig. 32
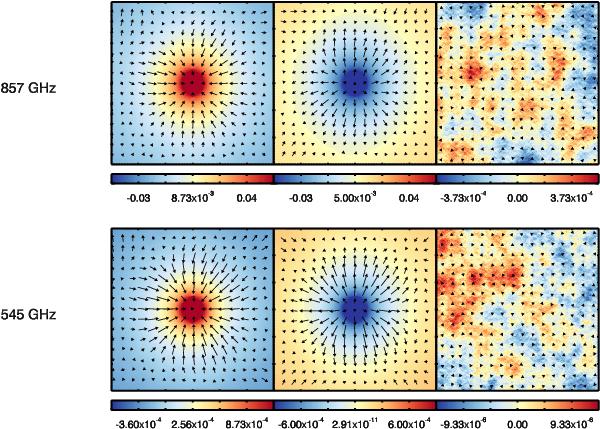
Temperature maps 1°× 1° at 545 and 857 GHz stacked on the 20 000 brightest peaks (left column) and valleys (centre column), and on 20 000 random map locations (right column). The temperature scale is in Kelvin. The arrows indicate the lensing deflection angle deduced from the gradient of the band-pass-filtered lensing potential map (Planck Collaboration XVII 2014) stacked on the same peaks. The longest arrow corresponds to a deflection of 6.̋3, which is only a fraction of the total deflection angle because of our filtering. This stacking allows us to visualize in real space the lensing of the CMB by the galaxies that generate the CIB. The small offset between the peak of the lensing potential and the CIB is due to noise in the stacked lensing potential map. We use the same random locations for both 545 and 857 GHz, hence the similar pattern seen in the top and bottom right panels.
Current usage metrics show cumulative count of Article Views (full-text article views including HTML views, PDF and ePub downloads, according to the available data) and Abstracts Views on Vision4Press platform.
Data correspond to usage on the plateform after 2015. The current usage metrics is available 48-96 hours after online publication and is updated daily on week days.
Initial download of the metrics may take a while.