Free Access
Fig. 31
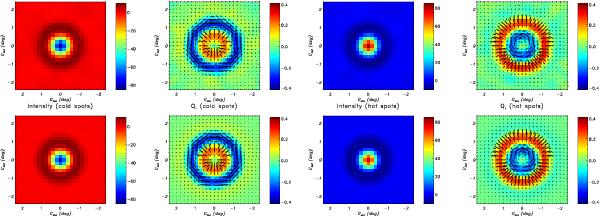
Stacked maps of CMB intensity I and polarization Qr at the position of the temperature extrema, at a common resolution of 30′. Maps stacked on CMB cold spots are on the left; maps stacked on hot spots are on the right. Measured data on the top row are compared to the Planck best-fit ΛCDM model prediction on the bottom row.
Current usage metrics show cumulative count of Article Views (full-text article views including HTML views, PDF and ePub downloads, according to the available data) and Abstracts Views on Vision4Press platform.
Data correspond to usage on the plateform after 2015. The current usage metrics is available 48-96 hours after online publication and is updated daily on week days.
Initial download of the metrics may take a while.