Fig. 29
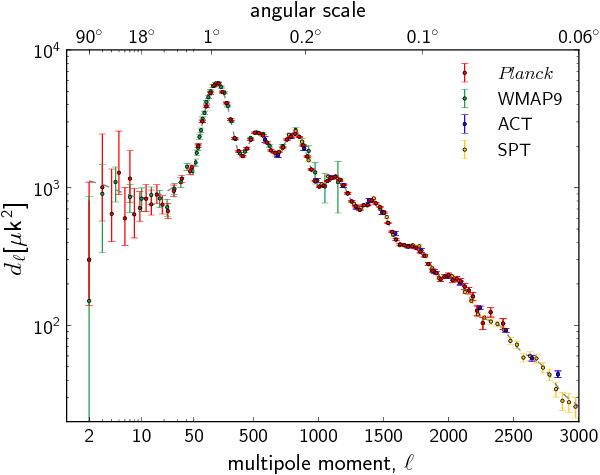
Measured angular power spectra of Planck, WMAP9, ACT, and SPT. The model plotted is Planck’s best-fit model including Planck temperature, WMAP polarization, ACT, and SPT (the model is labelled [Planck+WP+HighL] in Planck Collaboration XVI 2014). Error bars include cosmic variance. The horizontal axis is logarithmic up to ℓ = 50, and linear beyond.
Current usage metrics show cumulative count of Article Views (full-text article views including HTML views, PDF and ePub downloads, according to the available data) and Abstracts Views on Vision4Press platform.
Data correspond to usage on the plateform after 2015. The current usage metrics is available 48-96 hours after online publication and is updated daily on week days.
Initial download of the metrics may take a while.